Shop
Showing all 10 results
-

Building Blocks of Cloud
₹0.00 Add to basket -
Sale!

Cloud Engineer Bootcamp
Original price was: ₹25,000.00.₹15,000.00Current price is: ₹15,000.00. Add to basket -
Sale!
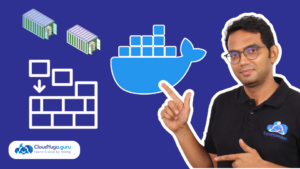
Container Fundamentals with Docker
Original price was: ₹1,999.00.₹999.00Current price is: ₹999.00. Add to basket -

Docker 101
₹0.00 Add to basket -
Sale!
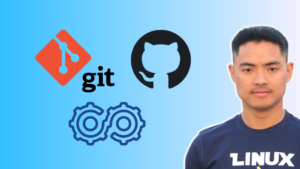
Git and GitHub for DevOps Engineer
Original price was: ₹1,999.00.₹999.00Current price is: ₹999.00. Add to basket -

Kubernetes 101
₹0.00 Add to basket -
Sale!

Kubernetes Developer (CKAD) Training
Original price was: ₹2,499.00.₹1,499.00Current price is: ₹1,499.00. Add to basket -
Sale!

Kubernetes for Administrators (CKA)
Original price was: ₹3,999.00.₹1,499.00Current price is: ₹1,499.00. Add to basket -
Sale!

Mastering Linux
Original price was: ₹2,499.00.₹1,299.00Current price is: ₹1,299.00. Add to basket -
Sale!

Mastering Shell Scripting
Original price was: ₹1,499.00.₹999.00Current price is: ₹999.00. Add to basket