Simplifying Cluster Security and Oversight by Using Vector Agents
Kubernetes has become the standard container orchestration tool for microservice-based deployments and managing large business applications. As Kubernetes has so many features, using and managing it can be difficult, especially keeping track of activities in the cluster. The main goal of this hands-on lab is to make available Kubernetes Audit Logs and store them in the Parseable, log storage backend to enable monitoring of all Kubernetes cluster-wide activities.

While working with the Kubernetes cluster, If we face any issue and want to know where it has happened, when it started, or who did it, we will check the Kubernetes audit logs. By default, the Kubernetes cluster itself doesn’t enable the audit logs. It has to be enabled by creating an audit policy and mentioning it in an API-server configuration file. We will demonstrate how Parseable stores audit logs through vector agents and extracts appropriate logs.
Pre-requisites
- Access to a Kubernetes cluster with admin privileges; if not available, you can set up a cluster using Minikube or Kind.
- Installation of kubectl on your local machine is necessary.
Let’s first, have a quick look at audit and event logs.
What Are Audit and Event Logs in Kubernetes?
Audit means recorded documentation of a sequence of actions occurring in the Kubernetes cluster. The Kubernetes cluster audits the following activities:
- The activity initiated by the user
- The application generated events that use Kubernetes API
- Kubelet activity
- Scheduler activity
- The events generated by the control plane etc.
How Auditing Works in Kubernetes?
The life cycle of an audit record starts inside the kube-APIserver component. Each request generates an audit event at each stage of execution, which is eventually pre-processed with a specific policy and written to a backend. The audit policy instructs what type of data should be recorded and these records are stored in the backends. Please refer to our hands-on lab on auditing to get a detailed understanding.
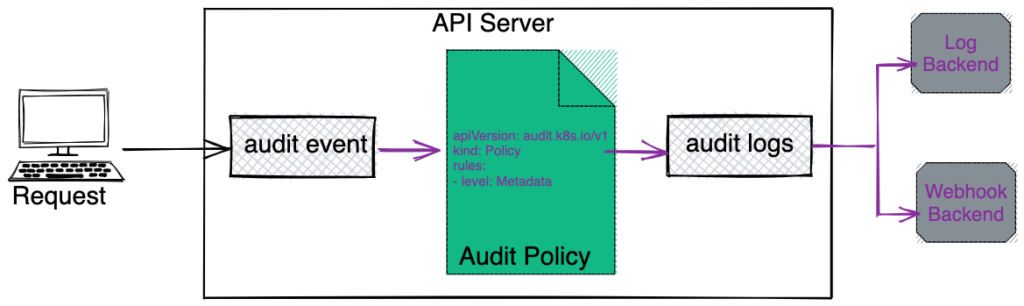
Audit Policy
Audit Policy defines a set of rules, which specifies which event should be recorded and what data should be included in audit logs. When any event occurs it matches with the set of rules defined in the policy.
Now, Let’s enable auditing in Kubernetes.
Auditing in Kubernetes with Vector and Parseable
We’ll implement Audit logs in Kubernetes, store them in a local file system, and configure Vector, a lightweight, ultra-fast tool to send logs to the Parseable server. At last, we will verify audit logs in Parseable UI with secret.
Here is the high-level architecture that shows what we would achieve from this blog.
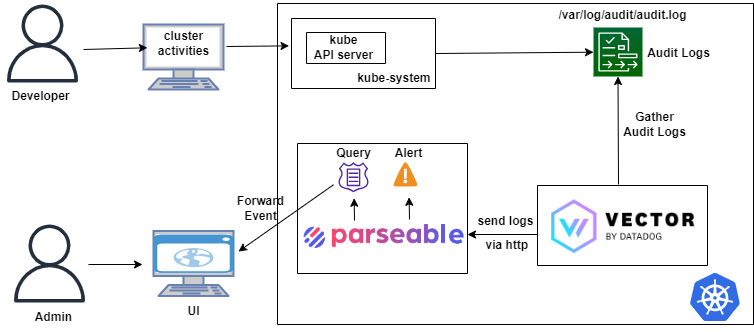
We will perform the following tasks to understand how Parseable helps us in Kubernetes auditing.
- Enable auditing in the Kubernetes cluster and store it locally.
- Send Audit Logs in Parseable through Vector.
- Audit Kubernetes Secrets access with Parseable.
Implementation of Kubernetes Audit Log
First, we will enable audit logs in Kubernetes and store them in the local filesystem.
- Run the following bash script
k8s-audit-config.shto enable audit logs in Kubernetes. You can refer to our hands-on lab on Kubernetes Auditing for more details
#k8s-audit-config.sh
#!/bin/sh
#k8s-audit-config.sh
# Copy audit policy file into kubernetes directory to enforce the rules.
cp audit-policy.yaml /etc/kubernetes/
# Make a directory to store audit logs.
mkdir -p /var/log/audit
# Store kube-apiserver.yaml manifest as a backup.
mv /etc/kubernetes/manifests/kube-apiserver.yaml /tmp/kube-apiserver-bkp.yaml
# Extract IP address of a host system and store in variable.
x=`hostname -I | awk '{print $1}'`
# Replace IP specified in kube-apiserver-audit-enabled.yaml with host-IP.
sed -e -i "s/10.0.0.150/$x/g" kube-apiserver-audit-enabled.yaml
# Copy updated audit enabled yaml file to the right place in kubernetes directory.
cp kube-apiserver-audit-enabled.yaml /etc/kubernetes/manifests/kube-apiserver.yaml
bash k8s-audit-config.sh
- Wait for some time for the
Kube-API serverpod to get started.
kubectl get nodes
- We will get audit logs in
/var/log/audit/audit.logfile.
Extract Audit Logs in Parseable
In this section, we will get audit logs in Parseable via Vector agent and confirm their presence in Parseable UI.
Parseable Installation
Parseable is a lightweight, high-speed, logging, and observability platform for cloud-native applications. Please refer to our previous hands-on lab on Parseable for more details. For this lab, we’ll automate the steps via a script.
- Run the following script
parseable-installation.shto install the Parseable quickly,
#parseable-installation.sh
#!/bin/sh
#parseable-installation.sh
#Step 1: Create a secret file
cat << EOF > parseable-env-secret
addr=0.0.0.0:8000
staging.dir=./staging
fs.dir=./data
username=admin
password=admin
EOF
# Step 2: Create a parseable namespace & secret
kubectl create ns parseable
kubectl create secret generic parseable-env-secret --from-env-file=parseable-env-secret -n parseable
# Step 3: Install  Parseable using helm
helm repo add parseable https://charts.parseable.io
helm install parseable parseable/parseable -n parseable --set "parseable.local=true"
# Step 4: Do the patching to expose Parseable service on port 31000
kubectl port-forward svc/parseable 8000:80 -n parseable
bash parseable-installation.sh
- Wait for some time for the Parseable pod to get started.
kubectl get pods -n parseable
Now, our application is ready and exposed on your browser to http://localhost:8000 and see the Parseable login page. You can use admin as a username and password to log in.
We’ll now use Vector logging agent, which will configure Kubernetes audit logs as its data source, and sink it to the Parseable server. Please refer to our hands-on lab to understand how Vector works.
Install and Configure Vector Agent
We’ll install Vector via Helm. We’ll use values-vector.yaml file attached in the lab-setup that has the configuration details for the vector source and sink.
It will provide us with a fast and efficient way to push logs to Parseable over HTTP.
helm repo add vector https://helm.vector.dev
helm install vector vector/vector --namespace vector --create-namespace --values values-vector.yaml
kubectl get pods -n vector
Vector is now ready to collect logs from the audit.log file in the auditdemo log stream. The vector log stream is created through request headers mentioned in values-vector.yaml file.
- Vector accesses the
/var/log/audit/audit.logfile to fetch the logs.
Now, we can observe Audit logs more clearly with a log stream auditdemo in Parseable UI. Let’s use it more with Kubernetes secrets.
Auditing Kubernetes Secrets with Parseable
Developers have security concerns about deploying secrets in Kubernetes as they are only encoded, not encrypted by default. And due to this they have to be very careful regarding who should have access to secrets.
To demonstrate this issue, we are going to create a secret. We’ll create two Service Accounts and by mistake, we will give the secret read/write access via RBAC Policy to both service accounts instead of one. We’ll create two pods using a custom service account and read the secret from the pods using a custom service account. Also, we will set alerts for unauthorized secret access to one of the service accounts through Parseable.
Create a Secret
we’ll encode our secret data like username and password.
echo -n cloudyuga | base64
echo -n cloudyuga@123 | base64
Using the above encoded data, create a configuration file to create a secret. (secret.yaml is attached to the lab-setup)
- Create a secret from
secret.yamlmanifest.
kubectl apply -f secret.yaml
- List the secret.
kubectl get secrets
Custom Kubernetes Service Accounts
Now let’s create Service Accounts to assign a role via kubernetes RBAC policies.
- Create a custom service accounts
kubectl create sa cloudyuga-test
kubectl create sa test-demo
kubectl get sa
We are required to assign a role to the cloudyuga-test service account to manage secrets but by mistake, we will give access to the other service account test-demo as well. And on this basis, we will create an alert.
Set RBAC Policies to the Kubernetes Service Accounts
By mistake, we will be giving access to manage secrets to both Service Accounts. The following is the role.yaml manifest .
# role.yaml
apiVersion: rbac.authorization.k8s.io/v1
kind: Role
metadata:
  name: deployment-manager
rules:
- apiGroups: ["","apps"] # "" indicates the core API group
  resources: ["pods","deployments","replicasets","configmaps", "secrets"]
  verbs: ["get", "watch", "list","create","update"]
- Create a role and set RBAC Policy by applying the
role.yamlconfiguration file.
kubectl apply -f role.yaml
- Assign the above role to both Service Accounts, which we created in the previous sub-section using the following YAML manifest.
# role-binding.yaml
apiVersion: rbac.authorization.k8s.io/v1
kind: RoleBinding
metadata:
  name: deployment-manager-binding
subjects:
- kind: ServiceAccount
  name: cloudyuga-test
- kind: ServiceAccount
  name: test-demo
roleRef:
  kind: Role
  name: deployment-manager
  apiGroup: rbac.authorization.k8s.io
- Apply
role-binding.yamlmanifest to the Service Accounts.
kubectl apply -f role-binding.yaml
We already misconfigured the RBAC Policy for test-demo Service Account. Now, what would be our next step?
Yes! we will try to read secrets from both accounts. For that, We’ll create pods using both custom Service Accounts.
Pods Creation with Custom Service Account
- Create a pod using
cloudyuga-testservice account.
kubectl apply -f pod-cloudyuga-test.yaml
- To list the pods
kubectl get pods
Next, we’ll try to retrieve secrets from the pods.
Exec into pod
- Now, exec into the
app-podof thecloudyuga-testservice account and try to access secrets through curl
kubectl exec -it app-pod -- sh
- Apply the following commands to access the secrets through curl from the pod.
cd /var/run/secrets/kubernetes.io/serviceaccount/
ls -la
export APISERVER=https://${KUBERNETES_SERVICE_HOST}
export SERVICEACCOUNT=/var/run/secrets/kubernetes.io/serviceaccount
export NAMESPACE=$(cat ${SERVICEACCOUNT}/namespace)
export TOKEN=$(cat ${SERVICEACCOUNT}/token)
export CACERT=${SERVICEACCOUNT}/ca.crt
curl --cacert ${CACERT} --header "Authorization: Bearer ${TOKEN}" -X GET ${APISERVER}/api/v1/namespaces/${NAMESPACE}/secrets
We got all the details of secrets through curl.
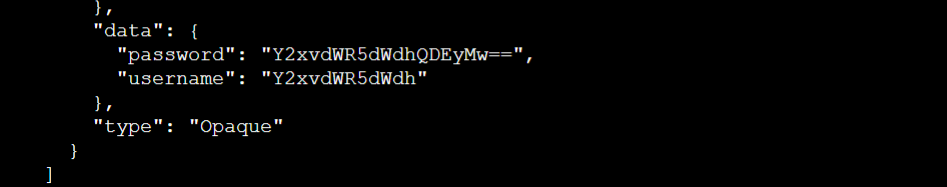
- Let’s decode the secret

Here we can read the username or password which are stored as a secret.
Now, create an alert with Parseable to get notified when an unauthorized service account accesses the secret which can be resolved by fixing the misconfigured RBAC policy.
Generate an Alert in Parseable
Parseable allows us to generate an alert when secrets are read by an unauthorized service account.
- Use the following
JSON codeto set an alert from the Parseable UI. Clickconsole->config->alert. ClickSubmitbutton.
{
    "version": "v1",
    "alerts": [
        {
            "name": "Unauthorised access",
            "message": "secret was accessed by an unauthorised user",
            "rule": {
                "config": "(verb =% \"list\" or verb =% \"get\") and (objectRef_resource = \"secrets\" and user_username !% \"cloudyuga-test\")",
                "type": "composite"
            },
            "targets": [
                {
                    "type": "webhook",
                    "endpoint": "<webhook.site_custom_endpoint>",
                    "skip_tls_check": false,
                    "repeat": {
                        "interval": "10s",
                        "times": 5
                    }
                }
            ]
        }
    ]
}
Here, a cloudyuga-test service account is allowed to access the secret. If a secret is accessed by another Service Account it will generate an alert. Setup the target endpoint by going through https://webhook.site and copying your unique URL, for example, https://webhook.site/e10f820d-3b24-462d-92e7-cfde3a54e05d. Paste it in place of <webhook.site_custom_endpoint>
Next, we will try to access secrets from test-demo Service Account and check with the unique URL for alerts.
Trigger an Alert When Unauthorised SA Access the Secrets
- Create another pod using
test-demoservice account.
kubectl apply -f pod-test-demo.yaml
kubectl get pods
Now, exec into the pod with the test-demo service account as we have done previously.
kubectl exec -it test-pod -- sh
- Apply the following commands to access the secrets through curl from the pod
cd /var/run/secrets/kubernetes.io/serviceaccount/
ls -la
export APISERVER=https://${KUBERNETES_SERVICE_HOST}
export SERVICEACCOUNT=/var/run/secrets/kubernetes.io/serviceaccount
export NAMESPACE=$(cat ${SERVICEACCOUNT}/namespace)
export TOKEN=$(cat ${SERVICEACCOUNT}/token)
export CACERT=${SERVICEACCOUNT}/ca.crt
curl --cacert ${CACERT} --header "Authorization: Bearer ${TOKEN}" -X GET ${APISERVER}/api/v1/namespaces/${NAMESPACE}/secrets
Hey!! We accessed secrets through an unauthorized service account. How to know? To get detailed information about the issue, we need to check audit logs!!!
so, let’s verify how the above parseable setup can trigger an alert.
- Browse the URL again :
https://webhook.site
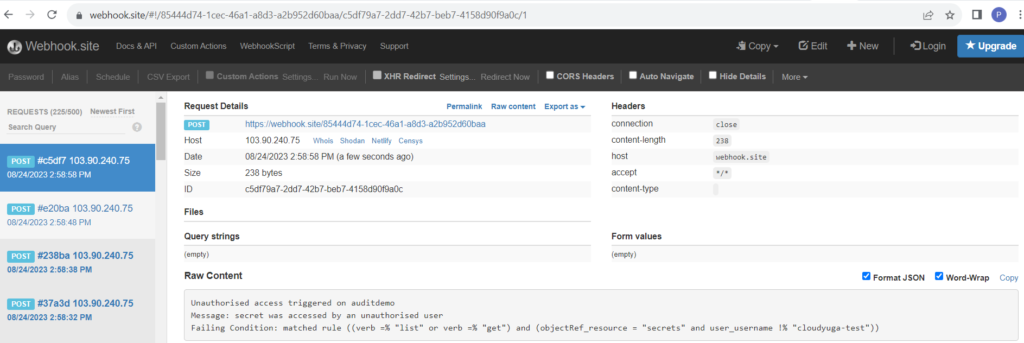
We can see an alert message “unauthorised access triggered in auditdemo” as shown in the above figure. We can also check the audit logs in Parseable UI. Through this, the cluster admin can find out the unauthorized activities in the cluster and fix them without taking much time.
Conclusion
We have seen how audit logs are enabled in Kubernetes and forwarded to Parseable servers via Vector agent. Using Parseable we can generate alerts for unauthorised access of secrets through service accounts.
