To know about autoscaling and its types in Kubernetes
Allocating resources to pods running inside the Kubernetes cluster is challenging as it gives rise to the questions such as how much CPU and RAM to allocate to pods for high performance and how to create enough replicas of these pods to handle the incoming load. For this, Kubernetes comes with a powerful feature called autoscaling.
In this blog, we will be going to see about different types of autoscaling and do enable autoscaling of pods through metrics server.
Autoscaling
Autoscaling is one of the important features in a Kubernetes cluster which helps in increasing or decreasing the number of pods or nodes according to the demand for service responses to it.
This helps in improving the overall resource utilization of the cluster by automatically adjusting the application resources and pods according to the load at a time and thus avoiding many manual tasks.
This autoscaling uses two types of mechanisms:
- Pod-based scaling – To automate the scaling of pods through Horizontal Pod Autoscaler (HPA) and Vertical Pod Autoscaler (VPA) methods.
- Node-based scaling – To automate the cluster node scaling through the Cluster Autoscaler(CA) method.
Horizontal Pod Autoscaler (HPA)
Horizontal Pod Autoscaler (HPA) scales the number of pod replicas automatically of workload resources such as Deployments/StatefulSets to match the workload demand. Horizontal scaling means that if the load gets increased then HPA instructs workload resources to deploy more pods(i.e. to scale up), and similarly, if the load gets decreased and the number of pods is already above the minimum configuration then HPA instructs workload resources to scale down.

Vertical Pod Autoscaler (HPA)
Vertical Pod Autoscaler (VPA) provides dynamic provisioning of compute resources (CPU and memory) to workload resources such as Deployments/StatefulSets based on the analysis of metrics collection from these workloads and automatically updates them so that the cluster resources are used efficiently.

Cluster Autoscaler (CA)
Cluster Autoscaler (CA) helps in maintaining the size of the Kubernetes cluster by dynamically adding or removing the nodes of the cluster based on the node utilization metrics and the number of pending pods that could not get scheduled due to shortage of resources.

As of now, we have discussed types of autoscaling in the Kubernetes cluster. In the next section, we will be seeing the working of Horizontal Pod Autoscaler as to what basis it scales the pod.
Working of Horizontal Pod Autoscaler
Horizontal Pod Autoscaling can work with both stateful and stateless applications but it can not work with Daemonsets as it can’t be scaled. This HPA is implemented as a Kubernetes API resource and controller.
This resource helps the controller running inside the Kubernetes control plane to adjust the desired scale of workload resources timely by matching the observed metrics such as average CPU utilization, average memory utilization, or any other custom metrics.
In the earlier Kubernetes version, Heapster was used as a metrics collector but due to its limited functionality it’s not in much use, later on, metrics API and metrics-server were introduced for metrics collection which can collect metrics from Kubernetes objects and can collect metrics on the number of HTTP requests.
By default, HPA collects metrics through metrics API, and the most commonly used is resource metrics which is implemented through metrics.k8s.io API provided through metrics-server.

Kubernetes implements the HPA in a control loop through the Kube-Controller manager by setting an interval of 15 seconds through --horizontal-pod-autoscaler-sync-period parameter.
In each of these periods, the Kube-controller-manager makes the resource utilization query against the metrics specified in the HPA definition and finds the target to be resourced through the scaleTargetRef field, and obtains the metrics either from resource metrics API or through custom metrics API.
HPA definition has a threshold value of CPU or memory utilization of workload and metrics are collected from metrics server and if the utilization is above the threshold then HPA scales up the pod and if it is less then it scales down.
The way HPA calculates a number of replicas is through the following formula
desiredReplicas = ceil[currentReplicas * ( currentMetricValue / desiredMetricValue )]
For example, if the current metric value is 400m, and the desired value is 100m, the number of replicas will be four times since 400.0 / 100.0 == 4.0
When a targetAverageValue or targetAverageUtilization is specified, the currentMetricValue is calculated by taking the average of the given metric across all the pods in the HorizontalPodAutoscaler’s scale target.
In the next section, we will be going to deploy a python web app through a NodePort service and then will increase the load on the app through locust and scale the pods through HPA.
Horizontal Pod Autoscaler LAB
- Deploy the front end of the application by creating a deployment and exposing it through a service.
# frontend.yaml
apiVersion: apps/v1
kind: Deployment
metadata:
  name: rsvp
spec:
  replicas: 1
  selector:
    matchLabels:
      app: rsvp
  template:
    metadata:
      labels:
        app: rsvp
    spec:
      containers:
      - name: rsvp-app
        image: teamcloudyuga/rsvpapp:latest
        resources:
          limits:
            cpu: "50m"
          requests:
            cpu: "50m"
        livenessProbe:
          httpGet:
            path: /
            port: 5000
          periodSeconds: 30
          timeoutSeconds: 1
          initialDelaySeconds: 50
        env:
        - name: MONGODB_HOST
          value: mongodb
        ports:
        - containerPort: 5000
          name: web-port
---
apiVersion: v1
kind: Service
metadata:
  name: rsvp
  labels:
    app: rsvp
spec:
  type: NodePort
  ports:
  - port: 80
    targetPort: web-port
    protocol: TCP
  selector:
    app: rsvp
kubectl apply -f frontend.yaml
Note: Remember to add resources (line 19) attributes for which you want to collect metrics using metrics-server and scale it using HPA.
- Create the backend of the app by creating its deployment and exposing it through service.
# backend.yaml
apiVersion: apps/v1
kind: Deployment
metadata:
  name: rsvp-db
spec:
  replicas: 1
  selector:
    matchLabels:
      appdb: rsvpdb
  template:
    metadata:
      labels:
        appdb: rsvpdb
    spec:
      volumes:
        - name: voldb
          emptyDir: {}
      containers:
      - name: rsvpd-db
        image: teamcloudyuga/mongo:3.3
        volumeMounts:
        - name: voldb
          mountPath: /data/db
        ports:
        - containerPort: 27017
---
apiVersion: v1
kind: Service
metadata:
  name: mongodb
  labels:
    app: rsvpdb
spec:
  ports:
  - port: 27017
    protocol: TCP
  selector:
    appdb: rsvpdb
kubectl apply -f backend.yaml
kubectl get pods,svc
- To access the application through browser deploy the ingress for it
# ingress.yaml
apiVersion: networking.k8s.io/v1
kind: Ingress
metadata:
  name: rsvp-ingress
spec:
  rules:
  - http:
      paths:
      - path: /
        pathType: Prefix
        backend:
          service:
            name: rsvp
            port:
              number: 80
kubectl apply -f ingress.yaml
kubectl get ingress
Now, access the app through the app-port-80 URL under the LAB-URL section and will get an rsvp app like shown in the image below.

- Then, to collect metrics through the metrics server, configure it through the following.
apiVersion: v1
kind: ServiceAccount
metadata:
  labels:
    k8s-app: metrics-server
  name: metrics-server
  namespace: kube-system
---
apiVersion: rbac.authorization.k8s.io/v1
kind: ClusterRole
metadata:
  labels:
    k8s-app: metrics-server
    rbac.authorization.k8s.io/aggregate-to-admin: "true"
    rbac.authorization.k8s.io/aggregate-to-edit: "true"
    rbac.authorization.k8s.io/aggregate-to-view: "true"
  name: system:aggregated-metrics-reader
rules:
- apiGroups:
  - metrics.k8s.io
  resources:
  - pods
  - nodes
  verbs:
  - get
  - list
  - watch
---
apiVersion: rbac.authorization.k8s.io/v1
kind: ClusterRole
metadata:
  labels:
    k8s-app: metrics-server
  name: system:metrics-server
rules:
- apiGroups:
  - ""
  resources:
  - nodes/metrics
  verbs:
  - get
- apiGroups:
  - ""
  resources:
  - pods
  - nodes
  verbs:
  - get
  - list
  - watch
---
apiVersion: rbac.authorization.k8s.io/v1
kind: RoleBinding
metadata:
  labels:
    k8s-app: metrics-server
  name: metrics-server-auth-reader
  namespace: kube-system
roleRef:
  apiGroup: rbac.authorization.k8s.io
  kind: Role
  name: extension-apiserver-authentication-reader
subjects:
- kind: ServiceAccount
  name: metrics-server
  namespace: kube-system
---
apiVersion: rbac.authorization.k8s.io/v1
kind: ClusterRoleBinding
metadata:
  labels:
    k8s-app: metrics-server
  name: metrics-server:system:auth-delegator
roleRef:
  apiGroup: rbac.authorization.k8s.io
  kind: ClusterRole
  name: system:auth-delegator
subjects:
- kind: ServiceAccount
  name: metrics-server
  namespace: kube-system
---
apiVersion: rbac.authorization.k8s.io/v1
kind: ClusterRoleBinding
metadata:
  labels:
    k8s-app: metrics-server
  name: system:metrics-server
roleRef:
  apiGroup: rbac.authorization.k8s.io
  kind: ClusterRole
  name: system:metrics-server
subjects:
- kind: ServiceAccount
  name: metrics-server
  namespace: kube-system
---
apiVersion: v1
kind: Service
metadata:
  labels:
    k8s-app: metrics-server
  name: metrics-server
  namespace: kube-system
spec:
  ports:
  - name: https
    port: 443
    protocol: TCP
    targetPort: https
  selector:
    k8s-app: metrics-server
---
apiVersion: apps/v1
kind: Deployment
metadata:
  labels:
    k8s-app: metrics-server
  name: metrics-server
  namespace: kube-system
spec:
  selector:
    matchLabels:
      k8s-app: metrics-server
  strategy:
    rollingUpdate:
      maxUnavailable: 0
  template:
    metadata:
      labels:
        k8s-app: metrics-server
    spec:
      containers:
      - args:
        - --cert-dir=/tmp
        - --kubelet-insecure-tls=true
        - --secure-port=4443
        - --kubelet-preferred-address-types=InternalIP,ExternalIP,Hostname
        - --kubelet-use-node-status-port
        - --metric-resolution=15s
        image: registry.k8s.io/metrics-server/metrics-server:v0.6.4
        imagePullPolicy: IfNotPresent
        livenessProbe:
          failureThreshold: 3
          httpGet:
            path: /livez
            port: https
            scheme: HTTPS
          periodSeconds: 10
        name: metrics-server
        ports:
        - containerPort: 4443
          name: https
          protocol: TCP
        readinessProbe:
          failureThreshold: 3
          httpGet:
            path: /readyz
            port: https
            scheme: HTTPS
          initialDelaySeconds: 20
          periodSeconds: 10
        resources:
          requests:
            cpu: 100m
            memory: 200Mi
        securityContext:
          allowPrivilegeEscalation: false
          readOnlyRootFilesystem: true
          runAsNonRoot: true
          runAsUser: 1000
        volumeMounts:
        - mountPath: /tmp
          name: tmp-dir
      nodeSelector:
        kubernetes.io/os: linux
      priorityClassName: system-cluster-critical
      serviceAccountName: metrics-server
      volumes:
      - emptyDir: {}
        name: tmp-dir
---
apiVersion: apiregistration.k8s.io/v1
kind: APIService
metadata:
  labels:
    k8s-app: metrics-server
  name: v1beta1.metrics.k8s.io
spec:
  group: metrics.k8s.io
  groupPriorityMinimum: 100
  insecureSkipTLSVerify: true
  service:
    name: metrics-server
    namespace: kube-system
  version: v1beta1
  versionPriority: 100
kubectl apply -f components.yaml
NOTE: Configure args – –kubelet-insecure-tls=true flag in the metrics-server deployment (check line number 136).
Check the metrics-server pod in the kube-system namespace
kubectl get pods -n kube-system
- Check the resource utilization of the pods by running the following command
kubectl top pod --namespace default
- Now to increase the load and usage on the app, install locust through pip, and install Flask as a prerequisite for locust.
apt update && apt install python3-pip -y
pip install flask
pip install locust
- Create a locustfile for load testing
# locust_file.py
import time
from locust import HttpUser, task, between
class WebsiteUser(HttpUser):
wait_time = between(1, 5)
@task
def check_page(self):
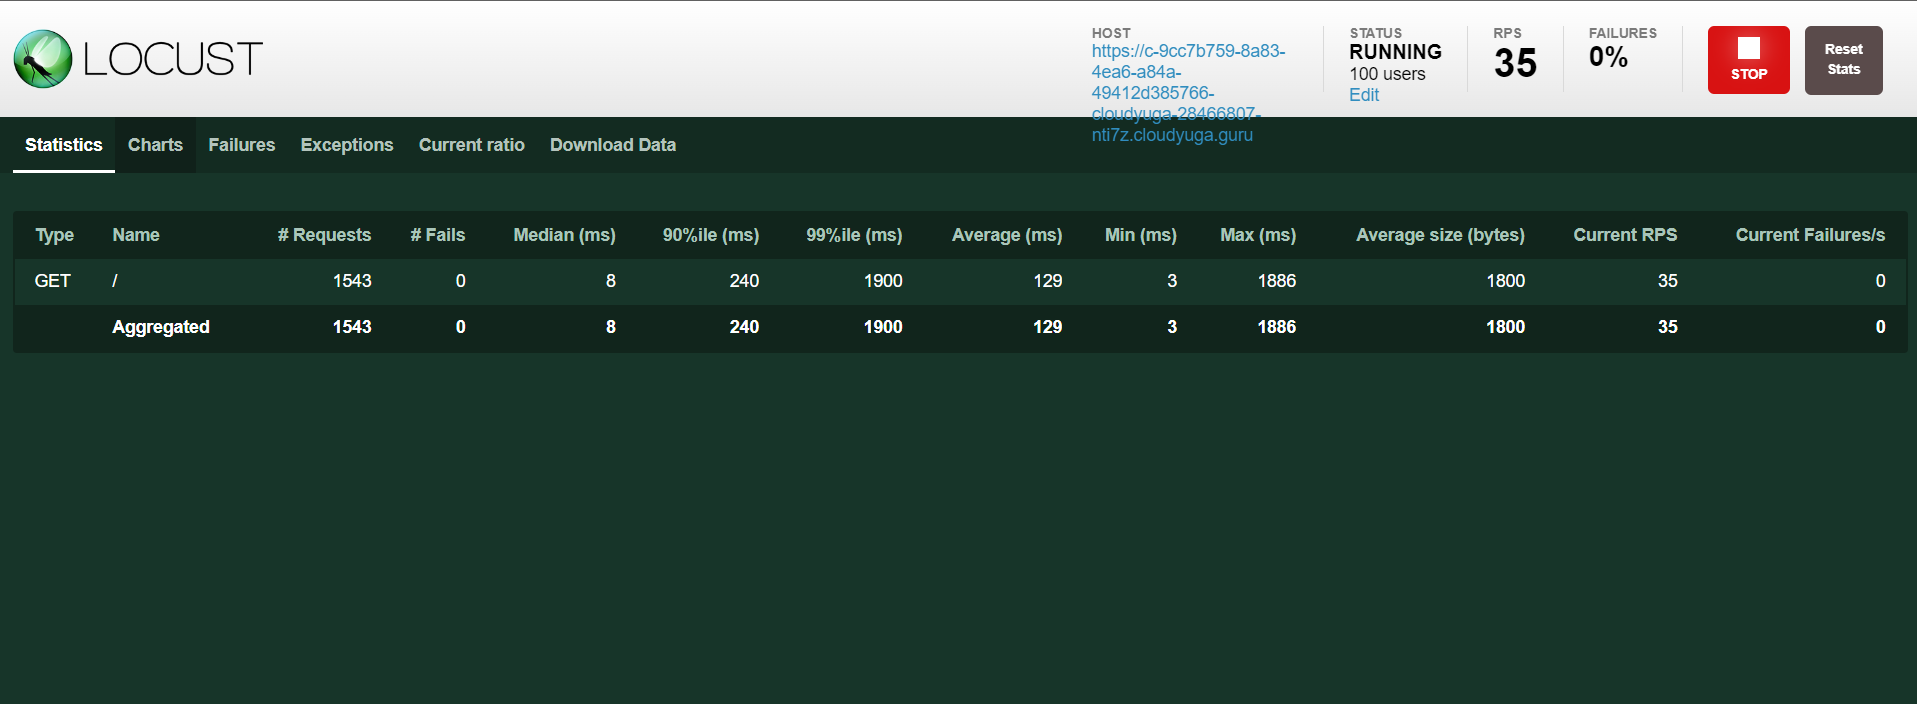
self.client.get(url="/")locust -f locust_file.py --host <APP_URL> --users 100 --spawn-rate 20 --web-port=8089
Here, replace <APP_URL> with the rsvp app URL and access the locust UI.

Click the Start swarming button in the locust UI to enable the load on the rsvp app and will see an output like below.
- To enable scaling of pods, create a Horizontal Pod Autoscaler for the
rsvpdeployment (frontend.yaml)
# hpa.yaml
apiVersion: autoscaling/v1
kind: HorizontalPodAutoscaler
metadata:
  name: frontend-hpa
spec:
  maxReplicas: 5
  minReplicas: 1
  scaleTargetRef:
    apiVersion: apps/v1
    kind: Deployment
    name: rsvp
  targetCPUUtilizationPercentage: 20
Here, inside scaleTargetRef (line 9) the kind of resource and its name has to be mentioned on which HPA has to be applied.
NOTE: In the rsvp deployment, we have specified CPU limits and requests and in this hpa object target value of CPU utilization is 20% . So as soon as the CPU utilization hits 20% or greater than it, scaling will take place.
kubectl apply -f hpa.yaml
kubectl get hpa
As soon as the load starts getting increased on the app, HPA will start working and will scale up the pods.
kubectl top pod --namespace default
kubectl get hpa
kubectl get pods
What Next?
As we have seen scaling the application on the basis of CPU metrics through HPA. In the blog, we will be scaling the same application with KEDA, a Kubernetes Event-Driven Autoscaling.
Conclusion
In this blog, we saw about autoscaling in Kubernetes and learned about the working of HPA and how to implement it.
