Why should everyone care about eBPF?
Using eBPF, we can now program the Linux Kernel dynamically and get insights, which was not easily possible earlier or were very expensive . It is changing the game in the system’s side the way JavaScript helped us bring everything on the browser. There are now many emerging use-cases of this technology. In this hands-on article, we’ll cover a bit of history, its use-cases and underlying implementation.
There is also very active work going on to support eBPF on Windows.
BPF(Berkeley Packet Filter)
As the name suggests, it was built to do the network packet filtering. Before BPF the packet filtering was done the User Space level, which is a very expensive operation. BPF allows this filtering to done at the Kernel Space and saved a lot of CPU cycles. It was implemented as Virtual Machine inside the kernel and because of which it can do filtering efficiently, while keeping a distance with and the kernel.

I am sure you would have used tcpdump, which used BPF behind the scene.
eBPF(extended Berkeley Packet Filter)
eBPF was included with the Linux Kernel 3.18 in December’14 with inclusion of the bpf() system call. It was also implemented as the kernel virtual machine but had 3 major improvements:-
- It was more efficient than
classic BPF - It was implemented for
general event processingandfilteringand not just network - It has a global data stores, which we call as
maps, to store the state between the events and share it withuser spaceas well.
The core of eBPF is to extend the capabilities of the kernel without requiring to change kernel source code or load kernel modules. Earlier to bring any change in the Linux Kernel was way too difficult and had a long development cycles. It would take years to bring to a new feature to the kernel, which eBPF fundamentally changes and bring dynamic programmability to the kernel, which is now opening up the doors for many new features.
Now the scope of eBPF is way beyond the network packet filtering, so sometime its name become a bit confusing. At some places you may see eBPF is referred as BPF only, so just be cautious. In such cases original BPF implementation is referred at Classic BPF (cBPF).
We can attach eBPF to different program like :-
- Any Linux Kernel function using kprobes
- User space program using uprobes
- Network Stack and Cards
- Userland Statically Defined Tracing (USDT)
- tracepoints
- perf_events
- and many more
eBPF use-cases
As we can attach eBPF to different programs, we are only limited by our imagination. Following are some of the prominent use-cases, which are now actively using eBPF:-
Networking
As eBPF programs can be attached to anywhere in the networking stack, we can enable some very powerful capabilities like skipping the iptables rules to route the traffic to pods in Kubernetes. Cilium and Calico projects have the eBPF based implementation.

eBPF had been battle tested for load balancing for highly scalable environment. Check the projects like Katran from Facebook and Unimog from CloudFlare.
There is also some active work going on implement Service Mesh using eBPF.
Security
As with eBPF we can have the visibility what is happening in realtime at the kernel and network level, we can build very powerful network and runtime security tools. Falco, Tracee and Kubernetes Network Policies are some of the examples of these.
Observability
Again as we can keep an eye on anything that is happening in the system using eBPF, we can have interesting observability tools built on top of it. Pixie, Parca and Cilium Hubble are some of tools, which are built for cloud native workloads.
Before we jump into its architecture or working, let us look at some of its examples to experience the simplicity.
eBPF Examples
Let’s use the bpftrace, which is the high-level tracing language to see some examples. To install it, please run the following commands:-
apt-get install -y bpftrace
- Get SystemCall counts by Programs
bpftrace -e 'tracepoint:raw_syscalls:sys_enter { @[comm] = count(); }'
- Print entered bash commands system wide
bashreadline.bt
- Trace new processes via exec() syscalls
execsnoop.bt
- Trace TCP active connections (connect()).
tcpconnect.bt
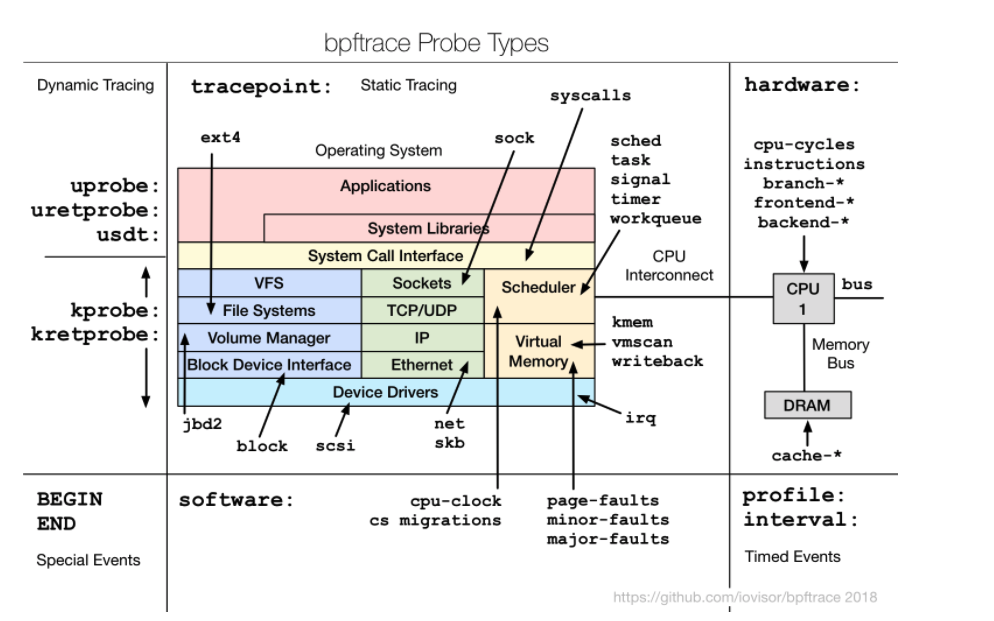
Following image shows where all we can put traces and it is very clear that we can do almost anywhere, based on our requirements.
How does eBPF works?
At a very high level we can breakdown the eBPF working into following steps :-

Bytecode Generation
The Linux kernel expects eBPF programs to be loadedin the form of bytecode, which is possible to write directly but very difficult. We can use the a compiler suite like LLVM to compile pseudo-C code into eBPF bytecode but that may still be hard. That is why there are different development toolchains are available to make things easier for the developer and some of these are:-
- BPF Compiler Collection (bcc)
- bpftrace
- eBPF Go Library
- libbpf C/C++ Library
Load and Setup
Once the bytecode is generated, it can be loaded using bpf() systemcall. First it would get verified to make sure that it not unsafe for the kernel. Post that it would be translated into the machine (architecture) specific instruction set, using Just-in-Time (JIT) compilation step. This make eBPF programs to run as efficiently as natively compiled kernel code.
Event Attachment
After we have setup the BPF virtual machine, we can attach it to any event of our wish.
Data Collection and Sharing
BPF virtual machine by itself does not collect any information. It would be shared with User Space or other eBPF programs, either as per event data or maps. There are different kind of maps are support to store the event data.
- Hash tables, Arrays
- LRU (Least Recently Used)
- Ring Buffer
- Stack Trace
- LPM (Longest Prefix match)
- …
Writing a sample Program with bcc
As we know there are many front ends are available to generate the bytecode for the eBPF program. In this section we’ll the BPF Compiler Collection (bcc) toolkit to create python program, which would help us generate the bytecode for eBPF program using C, load the program and attach it to a kernel event.

For that we need to first install the bpfcc-tools and linux-headers packages.
apt-get install bpfcc-tools linux-headers-$(uname -r) -y
After that let us run the following program, using which we are attaching the hello function to every clone system call.
from bcc import BPF

# define BPF program
prog = """
int hello(void *ctx) {
    bpf_trace_printk("Hello, k8s & cloud native community\\n");
    return 0;
}
"""

# load BPF program
b = BPF(text=prog)
b.attach_kprobe(event=b.get_syscall_fnname("clone"), fn_name="hello")

# header
print("%-18s %-16s %-6s %s" % ("TIME(s)", "COMM", "PID", "MESSAGE"))

# format output
while 1:
    try:
        (task, pid, cpu, flags, ts, msg) = b.trace_fields()
    except ValueError:
        continue
    print("%-18.9f %-16s %-6d %s" % (ts, task, pid, msg))
python3 hello_fields.py
After running the the program, try to perform some operations on other terminal and and you would see the output like following:-

Conclusion
So in this hands-on blog/lab we have covered a bit of history eBPF, its use-cases and underlying implementation. We have scratched the surface. In the near future we’ll be seeing some great innovation around it, specially in the Kubernetes eco-system.
