Exploring different kinds of Kubernetes Logs and the Logging Pipeline
Kubernetes, an open-source container orchestrator, is designed to manage and deploy applications at scale. While working with Kubernetes, Developers and DevOps engineers should know how to troubleshoot clusters and find issues via different kind of logs. Due to its dynamic nature, it is challenging to centralize logs for monitoring.
We all know, Logs are the files that list the events that have happened. It is all about the details of past operations related to the computer’s OS or software running on that system. In this hands-on lab, you will find complete logging solutions in Kubernetes. We briefly introduce, what is logging in Kubernetes? How does it work? why is it required? different types of logs in Kubernetes and logging tools, which are widely used, and many more.
What is Logging?
In general computing, logging means a written record of events or operations in a computer system. For example, at an application level, it generates logs when an event occurs or affects the application.

Importance of Logging in Kubernetes
Logging is important to collect crucial information to debug and in many other aspects such as:
- To identify
issuesquickly and in advance - To
monitorthe performance of applications, nodes, and the cluster - To provide a
securitysuch as to protect from unauthorized access - To know the set of
actionsthat occurred in the Kubernetes cluster - To improve the
efficiencyof cluster operations
Logging in Kubernetes
To collect the logs from a Kubernetes cluster, we would need to collect the logs from the following:
- All logs from the
Applicationswhich are deployed on pods - All logs from the
Nodes - All logs from the Kubernetes
Control Plane Componentsand Worker Node
As there is no native solution for logging which would cover everything we mentioned above. But the following is how we can achieve it.
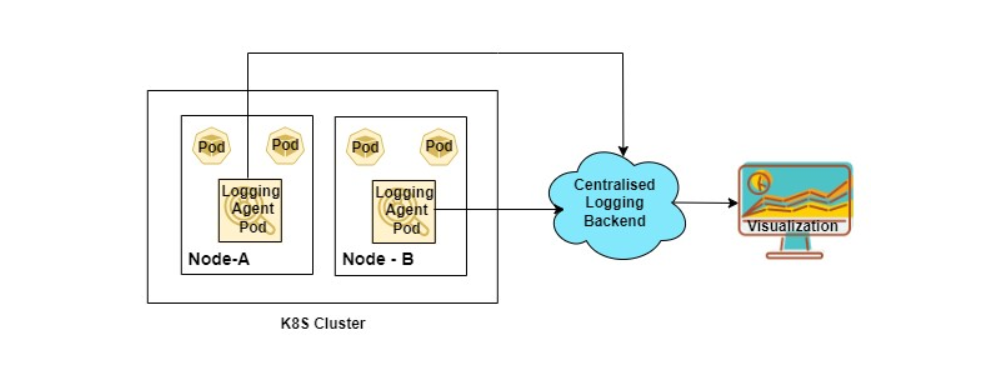
The above logging architecture diagram has the following components:
- Logging Agents: These are generally deployed as
DaemonSetin the cluster to collect node and application level logs. The aggregated logs are then sent to centralized locations. Some of the examples of logging agents are FluentD, Logstash etc. - Centralized Backend: It
stores,indexes,searchesandanalyzesthe log data such as Elasticsearch, Grafana Loki. - Visualization: It is used to
visualizelog data on thedashboard, such as Grafana, Kibana
We will deep dive into the architecture as we further proceed in this lab.
Application Level / Pod Level Logs
The logs of the applications running as a pod inside the Kubernetes cluster can be seen with kubectl. Let’s understand with an Example,
- Let’s create a nginx web server pod and observe its logs
kubectl run webapp --image=nginx
kubectl logs webapp

- If multiple containers run in the pod, specify the container’s name with -c flag
kubectl logs <pod-name> -c <container-name>
We can also check the pod’s logs and their containers, being sent to stdout or stderr, which are stored at /var/log/pods and /var/log/containers, respectively, on nodes.
If the container restarts, kubelet is responsible for keeping track of logs at the node level. Also, when a pod is evicted from the node, its container and respective logs are evicted.
- To list the log files of each pod on the node
ls -l /var/log/pods

- To check any pod’s and it’s respective container logs
cat <namespace_pod_name>/<container_name>/<file-name>.log

The files present in /var/log/containers are soft links to their respective /var/log/pods/<namespace_podname> folder.
- To list the log files of each running container on the node
ls -l /var/log/containers

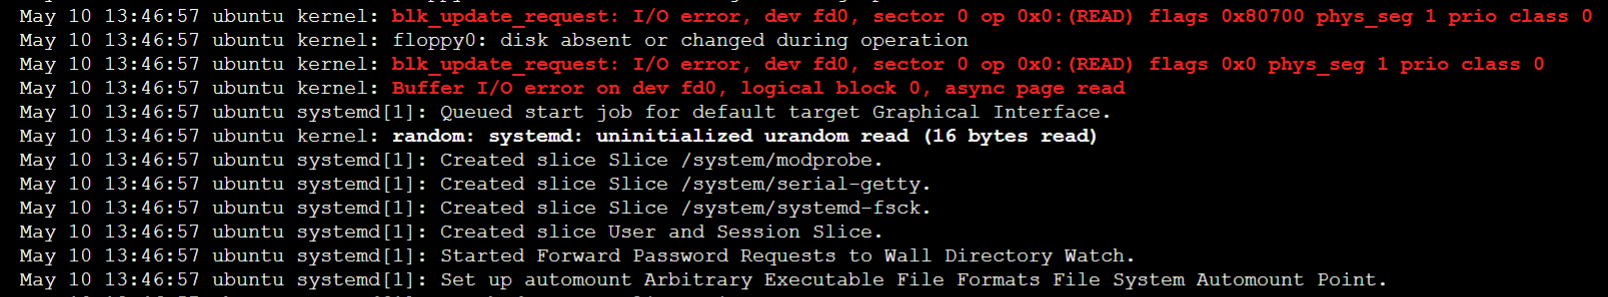
Node-Level Logging
Logging at the node level differs from the application level as it will also contain all the information related to node infrastructure. It would contain the following per node:
- Kernel Logs
- Systemd Logs
- Other OS Logs
To view the Kernel and the Systemd logs at node level with journald, we can run the following command
journalctl
To view the logs of a specific service such as kubelet, which is also a part of Kubernetes per node component
journalctl -fu kubelet
To get the other system-level logs that cannot be checked from the above two, can be found at /var/log/location. For example,

- To list the access and error logs of nginx web server
ls /var/log/nginx
- To get the content of
access.logfile
cat /var/log/nginx/access.log
- To get the content of
error.logfile
cat /var/log/nginx/error.log
We can collect the node level and application level logs using the log agents such as FluentD or Logstash which will have access to all the log files and directories. We can either run them on a specific node or as a DaemonSet on all nodes of the cluster depending on the use case.
Cluster-Level Logging
The cluster-level logs are the logs from,
- The applications running inside the Pods
- Nodes of the cluster
- Control-plane components
The first two we discussed above. As the Kubernetes cluster components are running as pods, the logs collector agent would collect the logs of the API Server and the other control-plane components; whereas kubelet logs are collected via systemd.
Apart from above we can use following to get additional details,
- Kubernetes Events
- Audit Logs
Kubernetes Events
Kubernetes events store information about the object state changes and errors. Events are stored in the API server on the control-plane node.
- To get event logs
kubectl get events -n <namespace>
We can also get events from a particular pod.
- To describe a pod
kubectl describe pod <pod-name>
Check the events at the end of the output.
To avoid using all disk space on the control-plane node, Kubernetes removes events after one hour.
Kubernetes Audit Logs
The audit log is detailed information about all the actions that happened in the cluster. It tracks all the activities in a sequence. It is used for security purposes to know who did what, when, and how? The audit policy has to be enabled to the master node only. Please refer to the Auditing lab to understand audit logs in detail.
Logging Pipeline
The Logging pipeline consists of collecting logs from different pod applications, aggregating and shipping them in the backend, where logs are stored. It is then used further for analysis and visualization. The logging pipeline is further divided into:
- Logging Libraries
- Logging Agents and Forwarders
- Logging Platforms
Logging Libraries
The logging libraries are used to get logs in pre-defined formats such as text, JSON and are generally chosen on the basis of programming languages, memory utilization preferences and so on. Some of the logging libraries are Log4j , Zap etc.
Logging Agents and Forwarders
The logging agents and forwarders help in collecting logs from the applications and forward them further to a centralized location. Both of them have little difference but are used interchangeably. Examples of logging agents are FluentD, Logstash, etc. and forwarders are FluentBit, Filebeat etc.
Logging Platforms
The logging platforms take and ingest logs coming from the logging agents/forwarders.It store them in reliable and secure manner with an interface to do analysis as required.
The different logging platforms are as follows:
Grafana Loki
Grafana Loki is an open-source log aggregation system that stores and queries logs from applications and infrastructure. It is highly scalable and can handle large amounts of log data. It has a minimum indexing approach that indexes the metadata of logs only. It stores data in highly compressed chunks, which also lowers the cost.
Features:
- Multi-tenancy
- Uses LogQL, Loki’s own query language
- Scalability and Flexibility
- Integrates with Grafana for visualization
We will be looking in more detail at Grafana Loki in future labs.
Elasticsearch
Elasticsearch is an open-source, distributed search and analytics engine developed in Java and built on Apache Lucene. It is one of the important components of the ELK stack (Elasticsearch, Logstash, Kibana). It is a NoSQL database.
Features:
- Query and analyze at a fast speed
- Scalability
- Resiliency
- Flexibility
We will look more closely at Elasticsearch and ELK stack in future labs.
Parseable
Parseable is an open-source, lightweight, cloud-native log observability engine written in Rust. It uses Apache Arrow and Parquet for easy access to data. It uses an index-free mechanism to organize and query data with low latency. It can be deployed anywhere. It is being designed stateless to make it compatible with cloud-native systems.
Features:
- Uses local volumes or S3-compatible object store
- Stateless and Index-free
- Autoscale based on log volume
- Parquet format
- Schema-free design
- Simple data access (PostgreSQL-based query for log data)
- Built-in GUI for log view and observability
We will be looking in more detail about Parseable in future labs.
Visualisation
The user-interactive data visualization platforms like Kibana, Grafana are powerful tools which helps in observing the state of the system.With the log visualizations, one can identify and analyze the issues easily. With different types of charts such as time-series, a user can check a particular log entry in the logging system. These visualizations can be filtered based on the time range, user permissions and so on.
Kubernetes Logging Best Practices
As far as we discussed in detail, logging in Kubernetes at each level and some of the logging tools. But while using it, one has to be assured about using it efficiently with minimum resource utilization. So below are some of the best practices to use logging in Kubernetes:
- Setting up the Logging System
- Write Logs to stdout and stderr
- Standard Logging Libraries
- Limit Log Volume with the log rotation policy
- Use independent cluster for development and production
We will publish a hands-on Lab to elaborate more on Kubernetes logging best practices in the future.
Conclusion
Logging plays a key role in debugging and troubleshooting the issues in the Kubernetes cluster. It may be easy to find and solve the issues easily if developers are familiar with the logging mechanism and how to use them. This hands-on lab discussed logging in Kubernetes, its types, and an overview of different logging tools with some of the best practices.
We hope this hands-on lab helped in the understanding of logging in detail. We’d love to hear comments from more people for betterment.
What’s next?
To learn more about the Parseable logging system and find out where it fits in the logging ecosystem and its work with an application. Try out our other hands-on lab on it.
References
https://kubernetes.io/docs/concepts/cluster-administration/logging/
https://loft.sh/blog/kubernetes-logging-a-comprehensive-guide/
https://logz.io/blog/open-source-monitoring-tools-for-kubernetes/
