Get started with Prometheus, its features, components and different type of metrics

Overview
Metrics is a way to measure something. The metrics provide an insight into the performance, and then based on these insights, we can take decisions to improve the infrastructure.
There are many tools that are available for monitoring like AppDynamics, Datadog, New Relic, Prometheus and many more. As Prometheus is an open-source monitoring tool, it is widely used.
In this blog, we will explore it and go through its different components and architecture, and finally see the types of Metrics offered by Prometheus.
What is Prometheus ?
Prometheus is an open-source tool used for monitoring and alerting.
Prometheus was originally built by SoundCloud. It is now a standalone open source project, under the Cloud Native Computing Foundation (CNCF).
Prometheus collects and stores its metrics as time series data. In time series data, metrics information is stored with the timestamp at which it was recorded.
Let’s consider a use case to understand it. If we have thousands of containerized applications running on VM’s and suddenly a few of VM’s ran out of memory, this will cause the Linux kernel to employ Out Of Memory Killer which may remove some of containers in order to free some memory. In order to avoid these conditions we can use Prometheus to monitor systems and take corrective action on time.
Features
Following are few main features of Prometheus:
- A multi-dimensional data model.
- Prometheus has PromQL that’s a flexible query language to utilize multi-dimensionality.
- Time series data collection is done via a pull method over HTTP.
- For short-lived jobs, Pushgateway is used as a way to push time series so that Prometheus can scrape data.
- Targets are tracked down by using service discovery or static configuration.
Components
The Prometheus ecosystem consists of multiple components. Let’s have a look at its primary components:
- Prometheus app – It is used to scrape metrics from HTTP endpoints after a regular interval of time and store them in a local or remote time-series database. We can fetch these metrics from Prometheus using a query language called PromQL.
- Exporters – It is software that can fetch metrics from a system (software or hardware) and can expose them via HTTP endpoints, so that Prometheus can scrape them.
- AlertManager – It is used to manage alerts and send notifications via Pagerduty, email, etc.
- Client Libraries – These are the libraries using we can instruments applications running on your systems e.g. Webserver, Database, Load Balancer for monitoring.
Architecture
Here is an image of an overview of the Prometheus architecture and some of its ecosystem components:
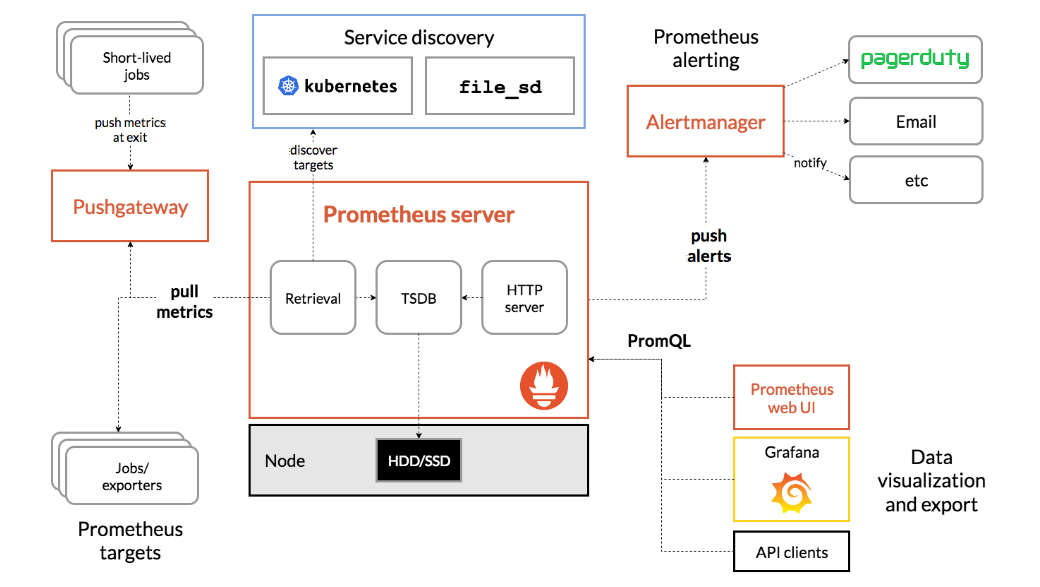
Prometheus works by pulling(scrapping) real-time metrics from targets on a regular interval by sending HTTP requests on their metrics endpoints. These targets can be VMs, Containers, Physical Machines, or anything that exports some metrics over HTTP endpoints. Then it stores the metrics in the Time Series Database. We can query the stored metrics using the PromQL. Alertmanager is configured to manage alerts send notifications via different tools like slack, email, etc.
About Lab Setup
You can bring the lab by clicking on the “Lab Setup” button present on the right hand side of the screen. Note that there are three app-specific URLs exposed specifically for the hands-on lab purpose.
Our lab has been set up with necessary tools like base OS (Ubuntu), developer tools like Git, Vim, wget and others.
Lab Workflow
Now that we have the basic understanding of Prometheus and it’s working. Following are the steps for our hands-on lab demo.
1. Install Prometheus server in the VM.
2. Install Node Exporter, this will gather data from the node.
3. Node Exporter will give the endpoints at which system metrics are displayed and from there Prometheus app would scrape the metrics.
By default Prometheus comes with a UI that can be accessed on port 9090 on the Prometheus server and Node Exporter can be accessed on port 9100 .
Setting up Prometheus
Let’s get a Prometheus server up and start scraping metrics.
1. First download the Prometheus tar file and extract it.
curl -L https://github.com/prometheus/prometheus/releases/download/v2.33.1/prometheus-2.33.1.linux-amd64.tar.gz --output prometheus-2.33.1.linux-amd64.tar.gz && tar -xf prometheus-2.33.1.linux-amd64.tar.gz
Our installation is done. Confirm by checking the version by running the commandshown below:
./prometheus-2.33.1.linux-amd64/prometheus --version
2. Configuring Prometheus
Targets are configured via Prometheus’s configuration file prometheus.yml.
# prometheus.yml
global:
  scrape_interval: 15s

scrape_configs:
  - job_name: "prometheus"

    static_configs:
      - targets: ["localhost:9090"]

  - job_name: "node"

    static_configs:
      - targets: ["localhost:9100"]
In this file, we have defined the interval of scrapping metrics (line 3) and two sources of metrics, for prometheus itself (line 6) and node (line 11). Then, we have specified the locations where these metrics are available, which we refer them as targets.
3. Start the Prometheus server.
nohup ./prometheus-2.33.1.linux-amd64/prometheus --config.file=prometheus.yml &
The above command will start the Prometheus server in the background.
Once the server is running, you can access the Prometheus Web UI through the prometheus-web URL on the right side of the webpage under the lab-urls section.
Node Exporter
Let us now install a program called Node exporter which would enables you to measure various machine resources such as memory, disk and CPU utilization of the node.
1. We will first download the Node Exporter tar file and extract it.
curl -L https://github.com/prometheus/node_exporter/releases/download/v1.3.1/node_exporter-1.3.1.linux-amd64.tar.gz -o node_exporter-1.3.1.linux-amd64.tar.gz && tar -xf node_exporter-1.3.1.linux-amd64.tar.gz
2. Start the Node Exporter program.
nohup ./node_exporter-1.3.1.linux-amd64/node_exporter &
Now you can access the Node Exporter UI through the node-exporter URL.

Types Of Metrics
There are four types of metrics in Prometheus based on their use cases:
1. Counter
Its value can only increase or be reset to zero on restart. Use cases for counters include request count, tasks completed, and error count. For example "node_disk_io_time_seconds_total", which shows the total time spent on doing I/O operations on disks.

2. Gauge
A gauge is a metric that represents a single numerical value that can arbitrarily go up and down. For example "node_memory_MemFree_bytes" shows the memory that is currently unused.

3. Histogram
This metric is suitable for aggregated measures, including request durations and response sizes. It is used for the calculation of averages or percentiles.
Here we are using the rate() function to specify the time window for the quantile calculation. For example, a histogram metric is called prometheus_http_request_duration_seconds_bucket. To calculate the 90th percentile of request durations over the last 10m, use the following expression "histogram_quantile(0.9, rate(prometheus_http_request_duration_seconds_bucket[10m]))"

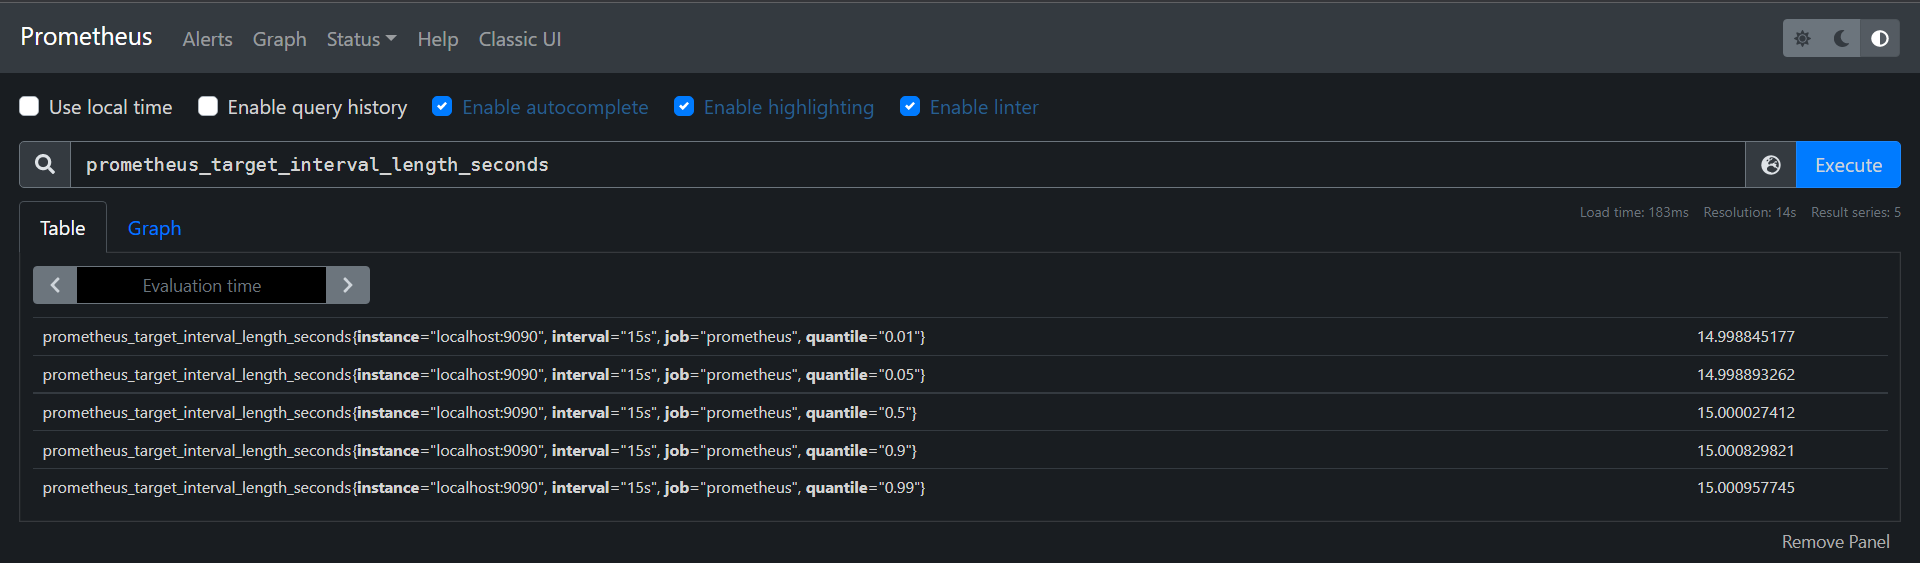
4. Summary
This metric is suitable for accurate quartiles. A summary sample usually observes things like request durations and response sizes. It also provides a total count of observations and a sum of all observed values. For example "prometheus_target_interval_length_seconds" shows the actual intervals between scrapes.
Conclusion
In this blog, we explored Prometheus, its different components, its architecture, monitored node via node exporter, and gone through different types of Prometheus metrics.
What’s Next
In the next blog we will explore Grafana and will setup Prometheus as a data source to it.
