To learn about Kubernetes Event-Driven Autoscaling (KEDA)
Autoscaling is one of the important features of Kubernetes and Horizontal Pod Autoscaler (HPA) comes to mind when pods need to be scaled on the basis of CPU and memory consumption. You can find out more about autoscaling and HPA through our Autoscaling in Kubernetes hands-on lab.
HPA is a good option to scale applications on the basis of CPU and memory metrics but in some cases, this is not enough especially when different and complex components are integrated with applications.
In this hands-on lab, we will be going to learn about the limitations of HPA and how KEDA helps in solving it.
Limitations of Horizontal Pod Autoscaler (HPA)
The limitations of HPA are :
- No external metric support: When working with distributed and complex applications, different components (event sources) are used with it such as Prometheus, Apache Kafka, cloud providers, and other events. As one would want to scale applications based on external metrics available through these events and not only through CPU and memory utilization.
- Scaling down to zero is impossible: HPA doesn’t have the functionality to scale pod replicas to zero when the load on the application is zero. It can only scale pods from 1 to n number of replicas, cannot scale it down to zero, or scale it up from zero to one.
So, to solve these problems, Kubernetes Event-Driven Autoscaler (KEDA) got introduced.
About Kubernetes Event-Driven Autoscaler (KEDA)
KEDA, a Kubernetes Event-Driven Autoscaler is a lightweight component that can be added to your Kubernetes cluster to scale applications based on the number of events it process. It makes autoscaling simple and optimizes the cost by providing a feature of scaling resources to zero.
KEDA works along with the Horizontal Pod Autoscaler (HPA) in a Kubernetes cluster by extending its functionality. KEDA provides 30+ built-in event-driven scalers which help in scaling the applications by managing the infrastructure itself. It also allows you to write your own custom scalers.
As KEDA helps in optimizing the cost, it can scale resources from 0 to 1 or 1 to 0. Scaling from 1 to n and back is being done by the HPA.
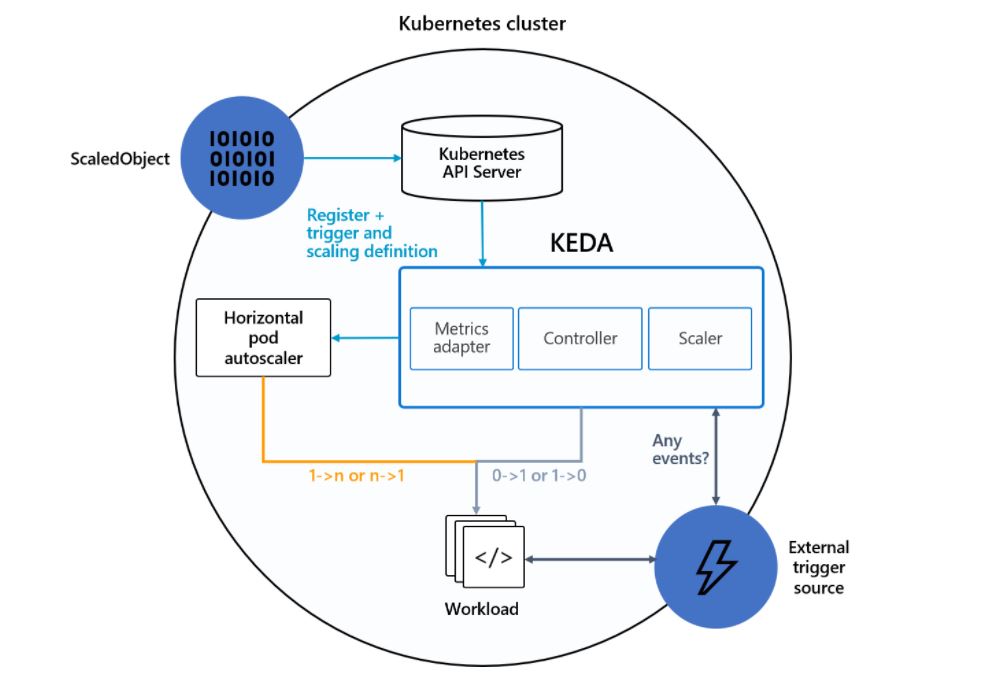
KEDA’s Architecture
The architecture and working of KEDA are quite simple to understand as there are three main components: metrics, operator and scaler.
- Operator (Agent): When KEDA is installed, an operator
keda-operatorgets created which is responsible for activating/deactivating deployments to scale to and from zero on events and also creates HPA objects in the cluster. - Metrics (Metrics Adapter): This helps in presenting event metrics data to HPA for scaling.
- Scalers: It connect to an external event component like Prometheus and fetches out the metrics, which helps in the scaling of resources.
Custom Resources
When KEDA is installed it creates four custom resources that help in mapping event-source with authentication to provision workload resources and jobs for scaling.
- ScaledObjects: It maps an event source like Prometheus to workload resources, let’s say, Kubernetes Deployment which needs to be scaled.
- ScaledJobs: It maps an even source with Kubernetes Jobs for scaling.
- TriggerAuthentication or ClusterTriggerAuthentication: It is defined inside
ScaledObject/ScaledJobfor authenticating the event sources.
Lab With KEDA
As we triggered the lab through the LAB SETUP button, a terminal, and an IDE comes for us which already have a Kubernetes cluster running in it. This can be checked by running the kubectl get nodes command.
kubectl get nodes
KEDA Installation
There are many ways to deploy KEDA in a Kubernetes cluster, and we will install it using Helm.
- First, do HELM installation
curl -fsSL -o get_helm.sh https://raw.githubusercontent.com/helm/helm/main/scripts/get-helm-3
chmod 700 get_helm.sh
./get_helm.sh
- Add Keda’s helm repo and install it inside the
kedanamespace.
helm repo add kedacore https://kedacore.github.io/charts
helm repo update
helm install keda kedacore/keda --namespace keda --create-namespace
kubectl get pods -n keda
Setting Up Application
- Deploy the frontend of the application by creating a deployment and exposing it through a service.
# frontend.yaml
apiVersion: apps/v1
kind: Deployment
metadata:
  name: rsvp
spec:
  replicas: 1
  selector:
    matchLabels:
      app: rsvp
  template:
    metadata:
      labels:
        app: rsvp
    spec:
      containers:
      - name: rsvp-app
        image: teamcloudyuga/rsvpapp:latest
        resources:
          limits:
            cpu: "50m"
          requests:
            cpu: "50m"
        livenessProbe:
          httpGet:
            path: /
            port: 5000
          periodSeconds: 30
          timeoutSeconds: 1
          initialDelaySeconds: 50
        env:
        - name: MONGODB_HOST
          value: mongodb
        ports:
        - containerPort: 5000
          name: web-port
---
apiVersion: v1
kind: Service
metadata:
  name: rsvp
  labels:
    app: rsvp
spec:
  type: NodePort
  ports:
  - port: 80
    targetPort: web-port
    protocol: TCP
  selector:
    app: rsvp
kubectl apply -f frontend.yaml
Note : Remember to add resources (line 19) attributes for which you want to collect metrics using metrics-server and scale it using HPA.
- Create the backend of the app by creating its deployment and exposing it through service.
# backend.yaml
apiVersion: apps/v1
kind: Deployment
metadata:
  name: rsvp-db
spec:
  replicas: 1
  selector:
    matchLabels:
      appdb: rsvpdb
  template:
    metadata:
      labels:
        appdb: rsvpdb
    spec:
      volumes:
        - name: voldb
          emptyDir: {}
      containers:
      - name: rsvpd-db
        image: teamcloudyuga/mongo:3.3
        volumeMounts:
        - name: voldb
          mountPath: /data/db
        ports:
        - containerPort: 27017
---
apiVersion: v1
kind: Service
metadata:
  name: mongodb
  labels:
    app: rsvpdb
spec:
  ports:
  - port: 27017
    protocol: TCP
  selector:
    appdb: rsvpdb
kubectl apply -f backend.yaml
kubectl get pods,svc
- To access the application through browser deploy the ingress for it
# ingress.yaml
apiVersion: networking.k8s.io/v1
kind: Ingress
metadata:
  name: rsvp-ingress
spec:
  rules:
  - http:
      paths:
      - path: /
        pathType: Prefix
        backend:
          service:
            name: rsvp
            port:
              number: 80
kubectl apply -f ingress.yaml
kubectl get ingress
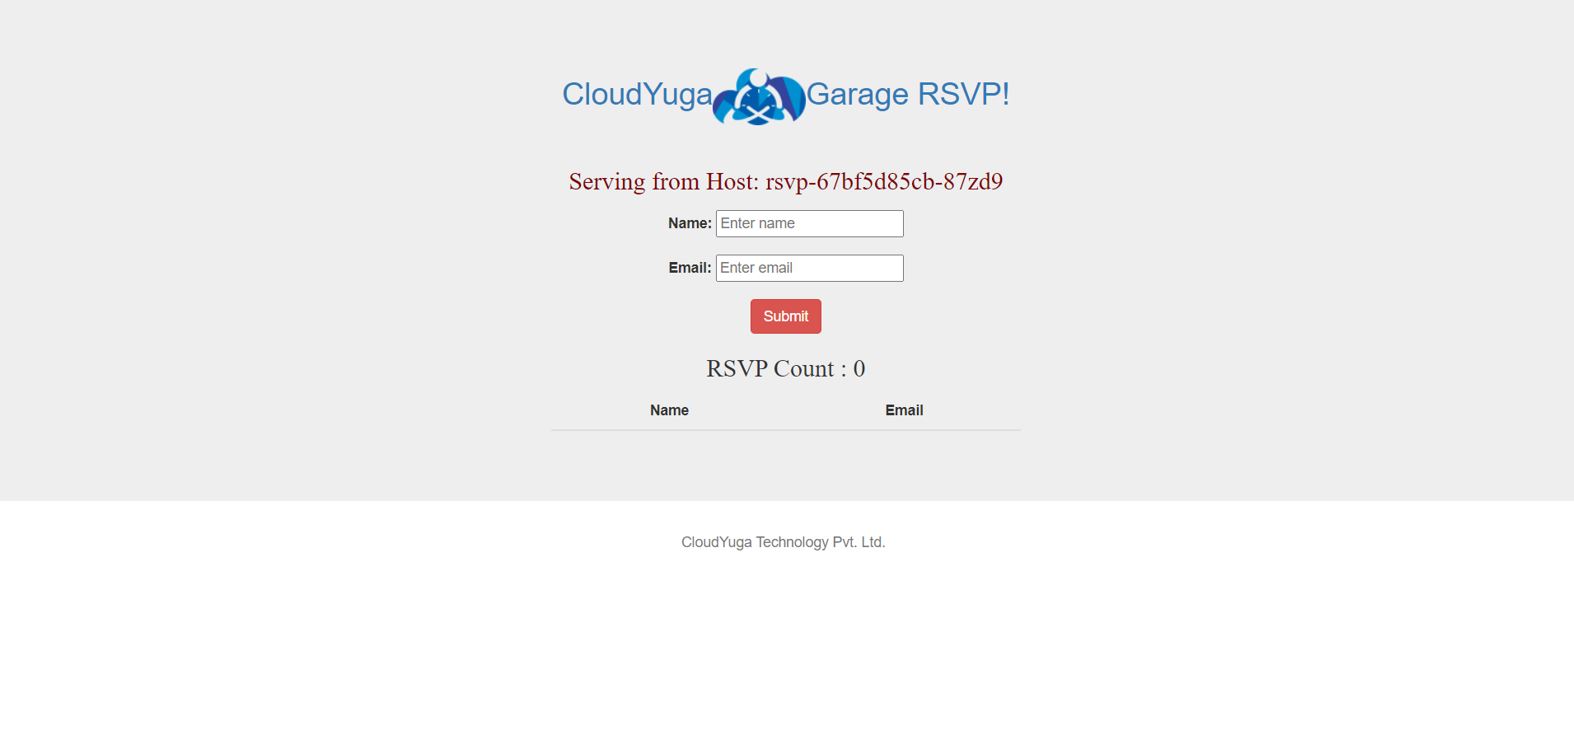
Now, access the app through the app on port 80 and will get an rsvp app like shown in the image below.
- To check the pod metrics, configure metrics server. Keda already has a metrics adapter for this but as an end-user to see CPU utilization, this needs to be installed.
apiVersion: v1
kind: ServiceAccount
metadata:
  labels:
    k8s-app: metrics-server
  name: metrics-server
  namespace: kube-system
---
apiVersion: rbac.authorization.k8s.io/v1
kind: ClusterRole
metadata:
  labels:
    k8s-app: metrics-server
    rbac.authorization.k8s.io/aggregate-to-admin: "true"
    rbac.authorization.k8s.io/aggregate-to-edit: "true"
    rbac.authorization.k8s.io/aggregate-to-view: "true"
  name: system:aggregated-metrics-reader
rules:
- apiGroups:
  - metrics.k8s.io
  resources:
  - pods
  - nodes
  verbs:
  - get
  - list
  - watch
---
apiVersion: rbac.authorization.k8s.io/v1
kind: ClusterRole
metadata:
  labels:
    k8s-app: metrics-server
  name: system:metrics-server
rules:
- apiGroups:
  - ""
  resources:
  - nodes/metrics
  verbs:
  - get
- apiGroups:
  - ""
  resources:
  - pods
  - nodes
  verbs:
  - get
  - list
  - watch
---
apiVersion: rbac.authorization.k8s.io/v1
kind: RoleBinding
metadata:
  labels:
    k8s-app: metrics-server
  name: metrics-server-auth-reader
  namespace: kube-system
roleRef:
  apiGroup: rbac.authorization.k8s.io
  kind: Role
  name: extension-apiserver-authentication-reader
subjects:
- kind: ServiceAccount
  name: metrics-server
  namespace: kube-system
---
apiVersion: rbac.authorization.k8s.io/v1
kind: ClusterRoleBinding
metadata:
  labels:
    k8s-app: metrics-server
  name: metrics-server:system:auth-delegator
roleRef:
  apiGroup: rbac.authorization.k8s.io
  kind: ClusterRole
  name: system:auth-delegator
subjects:
- kind: ServiceAccount
  name: metrics-server
  namespace: kube-system
---
apiVersion: rbac.authorization.k8s.io/v1
kind: ClusterRoleBinding
metadata:
  labels:
    k8s-app: metrics-server
  name: system:metrics-server
roleRef:
  apiGroup: rbac.authorization.k8s.io
  kind: ClusterRole
  name: system:metrics-server
subjects:
- kind: ServiceAccount
  name: metrics-server
  namespace: kube-system
---
apiVersion: v1
kind: Service
metadata:
  labels:
    k8s-app: metrics-server
  name: metrics-server
  namespace: kube-system
spec:
  ports:
  - name: https
    port: 443
    protocol: TCP
    targetPort: https
  selector:
    k8s-app: metrics-server
---
apiVersion: apps/v1
kind: Deployment
metadata:
  labels:
    k8s-app: metrics-server
  name: metrics-server
  namespace: kube-system
spec:
  selector:
    matchLabels:
      k8s-app: metrics-server
  strategy:
    rollingUpdate:
      maxUnavailable: 0
  template:
    metadata:
      labels:
        k8s-app: metrics-server
    spec:
      containers:
      - args:
        - --cert-dir=/tmp
        - --kubelet-insecure-tls=true
        - --secure-port=4443
        - --kubelet-preferred-address-types=InternalIP,ExternalIP,Hostname
        - --kubelet-use-node-status-port
        - --metric-resolution=15s
        image: registry.k8s.io/metrics-server/metrics-server:v0.6.4
        imagePullPolicy: IfNotPresent
        livenessProbe:
          failureThreshold: 3
          httpGet:
            path: /livez
            port: https
            scheme: HTTPS
          periodSeconds: 10
        name: metrics-server
        ports:
        - containerPort: 4443
          name: https
          protocol: TCP
        readinessProbe:
          failureThreshold: 3
          httpGet:
            path: /readyz
            port: https
            scheme: HTTPS
          initialDelaySeconds: 20
          periodSeconds: 10
        resources:
          requests:
            cpu: 100m
            memory: 200Mi
        securityContext:
          allowPrivilegeEscalation: false
          readOnlyRootFilesystem: true
          runAsNonRoot: true
          runAsUser: 1000
        volumeMounts:
        - mountPath: /tmp
          name: tmp-dir
      nodeSelector:
        kubernetes.io/os: linux
      priorityClassName: system-cluster-critical
      serviceAccountName: metrics-server
      volumes:
      - emptyDir: {}
        name: tmp-dir
---
apiVersion: apiregistration.k8s.io/v1
kind: APIService
metadata:
  labels:
    k8s-app: metrics-server
  name: v1beta1.metrics.k8s.io
spec:
  group: metrics.k8s.io
  groupPriorityMinimum: 100
  insecureSkipTLSVerify: true
  service:
    name: metrics-server
    namespace: kube-system
  version: v1beta1
  versionPriority: 100
kubectl apply -f components.yaml
kubectl get pods -n kube-system
- Check the resource utilization of the pods by running the following command
kubectl top pods
- Now to increase the load and usage on the app, install locust through pip, and install Flask as a prerequisite for locust.
apt update && apt install python3-pip -y
pip install flask
pip install locust
- Create a locustfile for load testing
# locust_file.py
import time
from locust import HttpUser, task, between
class WebsiteUser(HttpUser):
wait_time = between(1, 5)
@task
def check_page(self):
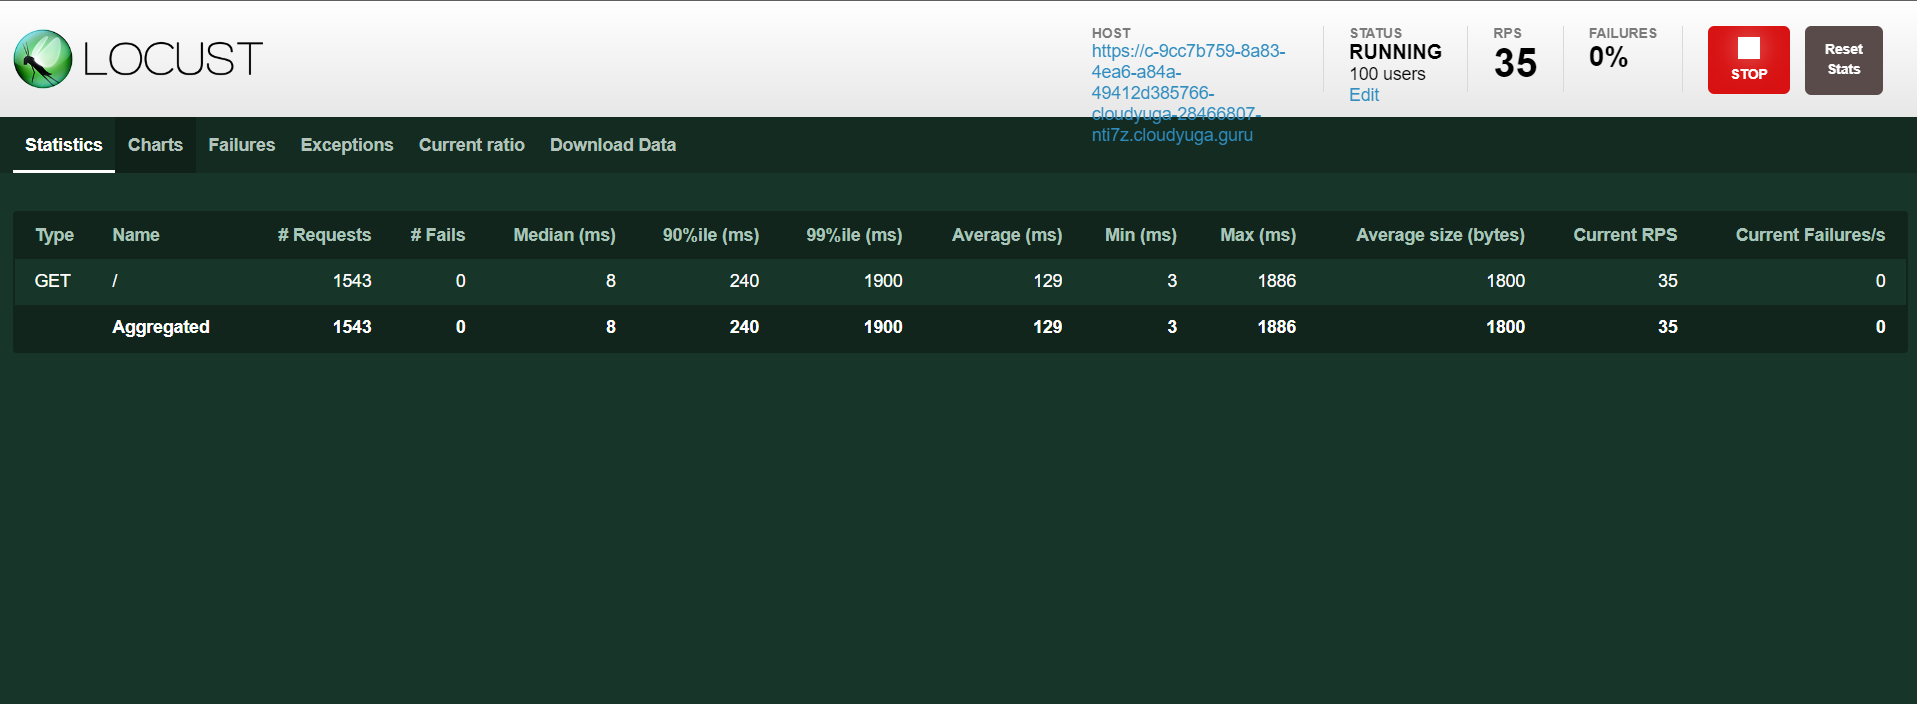
self.client.get(url="/")locust -f locust_file.py --host <APP_URL> --users 100 --spawn-rate 20 --web-port=8089
Here, replace <APP_URL> with the rsvp app URL and access the locust UI.
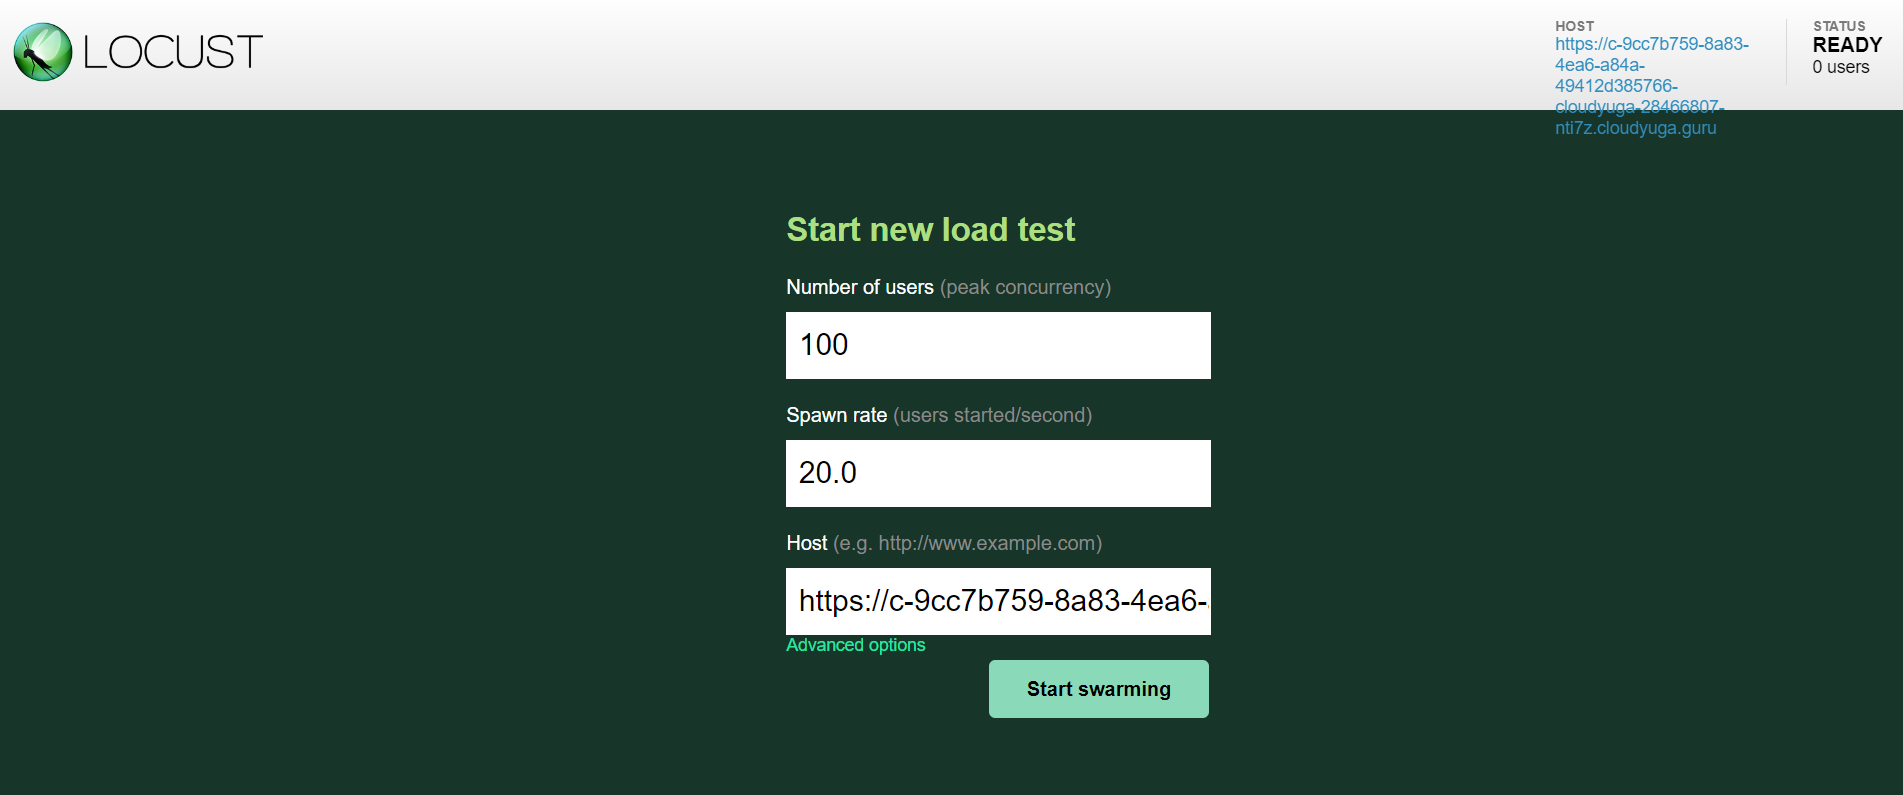
Click the Start swarming button in the locust UI to enable the load on the rsvp app and will see an output like below.
- To enable scaling of pods with KEDA, create a CPU ScaledObject for
rsvpdeployment (frontend.yaml)
# scaler.yaml
apiVersion: keda.sh/v1alpha1
kind: ScaledObject
metadata:
  name: cpu-scaledobject
  labels:
    app: rsvp
spec:
  maxReplicaCount: 5
  minReplicaCount: 1
  scaleTargetRef:
    name: rsvp
  triggers:
  - type: cpu
    metricType: Utilization # Allowed types are 'Utilization' or 'AverageValue'
    metadata:
      value: "20"
Here, inside scaleTargetRef (line 11), the name of the resource and, by default, its kind is deployment is mentioned along with the type of triggers currently here CPU to tell KEDA to scale the application accordingly.
NOTE: In the rsvp deployment, we have specified CPU limits and requests and in this scaled object target value of CPU utilization is 20m.So as soon as the CPU utilization hits 20m or greater than it, scaling will take place.
kubectl apply -f scaler.yaml
kubectl get scaledobjects
This ScaledObject will also create HPA, check that through the following command
kubectl get hpa
- As soon as the load starts getting increased on the application, KEDA starts working and will scale up the pods with HPA.
kubectl top pods
kubectl get hpa
kubectl get pods
What Next?
As we have seen scaling the application on the basis of CPU metrics with KEDA. In the next blog, we will be scaling the same application with Prometheus and KEDA.
Conclusion
In this blog, we saw the limitations of HPA and how KEDA solves it and implemented KEDA in a Kubernetes cluster.
