To use Kubernetes Event-Driven Autoscaling (KEDA) along with Prometheus to scale applications in Kubernetes cluster
Applications running inside the Kubernetes cluster need to be scaled according to the load it encounters with. Scaling is an important process for better performance of the application. Kubernetes provides Horizontal Pod Autoscaler (HPA) to scale applications with the help of resource metrics (CPU and Memory utilization).
But scaling on the basis of this is not enough, custom and external metrics are also required when the application is complex and using other components with it. And for this Kubernetes Event-Driven Autoscaling (KEDA) is used. More about HPA and KEDA can be found through our hands-on lab on it.

In this hands-on lab, we are taking one more step ahead in learning about scaling applications in the Kubernetes cluster by exposing applications metrics to Prometheus and scaling it with the help of KEDA.
Lab Setup
lab set up with all necessary tools like base OS (Ubuntu), developer tools like Git, Vim, wget, and others.
About KEDA And Prometheus
In this section, let’s quickly get acquainted with KEDA and Prometheus.
KEDA, a Kubernetes Event-Driven Autoscaler can be installed in the Kubernetes cluster alongside HPA to scale the applications on the basis of events it triggered. It extends the functionality of HPA.
KEDA comes with 30+ built-in scalers (events) through which applications scaled easily. Some of the scalers are Prometheus, Redis, etc. KEDA helps in optimizing the cost, it can scale resources from 0 to 1 or 1 to 0. Scaling from 1 to n and back is being done by HPA.
Prometheus, open-source software used for metrics-based monitoring and generating alerts is a project maintained under the hood of the Cloud Native Computing Foundation. It scrapes metrics from applications and stores them in a time-series database. It offers a query language PromQL which helps in querying the database and analyzing the performance of applications.
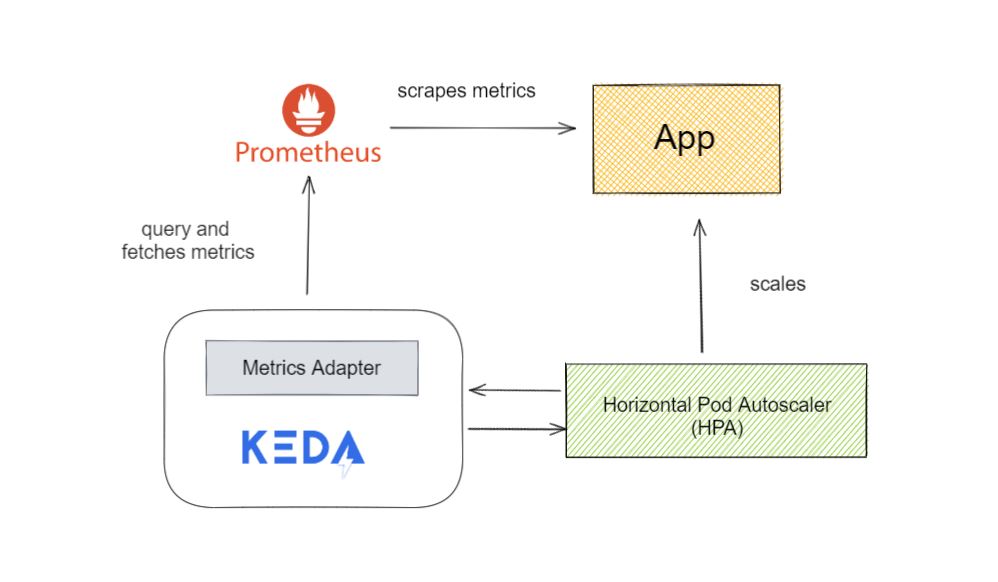
From the above diagram, it can be clearly seen that metrics adapter in KEDA fetches the application metrics from Prometheus scaler and on the basis of configuration in the Prometheus Scaled Object, KEDA and HPA then scale the application accordingly.
Lab With KEDA and Prometheus
As we triggered the lab through the LAB SETUP button, a terminal, and an IDE comes for us which already have a Kubernetes cluster running in it. This can be checked by running the kubectl get nodes command.
KEDA Installation
There are many ways to deploy KEDA in a Kubernetes cluster, and we will be installing it using helm.
- First, do HELM installation
curl -fsSL -o get_helm.sh https://raw.githubusercontent.com/helm/helm/main/scripts/get-helm-3
chmod 700 get_helm.sh
./get_helm.sh
- Add Keda’s helm repo and install it inside
kedanamespace.
helm repo add kedacore https://kedacore.github.io/charts
helm repo update
helm install keda kedacore/keda --namespace keda --create-namespace
- Check the Kedainstallation by checking its pod status.
kubectl get pods -n keda
Wait for some time to get the pods ready.
Prometheus Installation
- Install Prometheus in the Kubernetes cluster through helm by adding its repo.
helm repo add prometheus-community https://prometheus-community.github.io/helm-charts
helm repo update
helm install prometheus prometheus-community/prometheus --namespace prometheus --create-namespace
- Check the Prometheus installation by checking its pod status.
kubectl get pods -n prometheus
Wait for some time to get the pods ready.
- To access the Prometheus Server expose
prometheus-serverto NodePort service.
kubectl get svc -n prometheus
kubectl patch svc prometheus-server -n prometheus -p '{"spec": {"ports": [{"port": 80,"targetPort": 9090,"protocol": "TCP","nodePort": 30000}],"type": "NodePort","selector": {"app.kubernetes.io/name": "prometheus"}}}'In this, change the type:ClusterIP to type: NodePort and also add nodePort:30000 under ports attribute with the help of kubectl patch command.
Check the ports of the prometheus-server svc again. Also, access the Prometheus serve through the prometheus-ui.
Setting Up Application
- Deploy the frontend of the application by creating a deployment and exposing it through a service.
# frontend.yaml
apiVersion: apps/v1
kind: Deployment
metadata:
  name: rsvp
spec:
  replicas: 1
  selector:
    matchLabels:
      app: rsvp
  template:
    metadata:
      labels:
        app: rsvp
    spec:
      containers:
      - name: rsvp-app
        image: teamcloudyuga/rsvpapp:latest
        resources:
          limits:
            cpu: "50m"
          requests:
            cpu: "50m"
        livenessProbe:
          httpGet:
            path: /
            port: 5000
          periodSeconds: 30
          timeoutSeconds: 1
          initialDelaySeconds: 50
        env:
        - name: MONGODB_HOST
          value: mongodb
        ports:
        - containerPort: 5000
          name: web-port
---
apiVersion: v1
kind: Service
metadata:
  name: rsvp
  labels:
    app: rsvp
spec:
  type: NodePort
  ports:
  - port: 80
    targetPort: web-port
    protocol: TCP
  selector:
    app: rsvp
kubectl apply -f frontend.yaml
Note : Remember to add resources (line 19) attributes for which you want to collect metrics using metrics-server and scale it using HPA.
- Create the backend of the app by creating its deployment and exposing it through service.
# backend.yaml
apiVersion: apps/v1
kind: Deployment
metadata:
  name: rsvp-db
spec:
  replicas: 1
  selector:
    matchLabels:
      appdb: rsvpdb
  template:
    metadata:
      labels:
        appdb: rsvpdb
    spec:
      volumes:
        - name: voldb
          emptyDir: {}
      containers:
      - name: rsvpd-db
        image: teamcloudyuga/mongo:3.3
        volumeMounts:
        - name: voldb
          mountPath: /data/db
        ports:
        - containerPort: 27017
---
apiVersion: v1
kind: Service
metadata:
  name: mongodb
  labels:
    app: rsvpdb
spec:
  ports:
  - port: 27017
    protocol: TCP
  selector:
    appdb: rsvpdb
kubectl apply -f backend.yaml
kubectl get pods,svc
- To access the application through browser deploy the ingress for it
# ingress.yaml
apiVersion: networking.k8s.io/v1
kind: Ingress
metadata:
  name: rsvp-ingress
spec:
  rules:
  - http:
      paths:
      - path: /
        pathType: Prefix
        backend:
          service:
            name: rsvp
            port:
              number: 80
kubectl apply -f ingress.yaml
kubectl get ingress
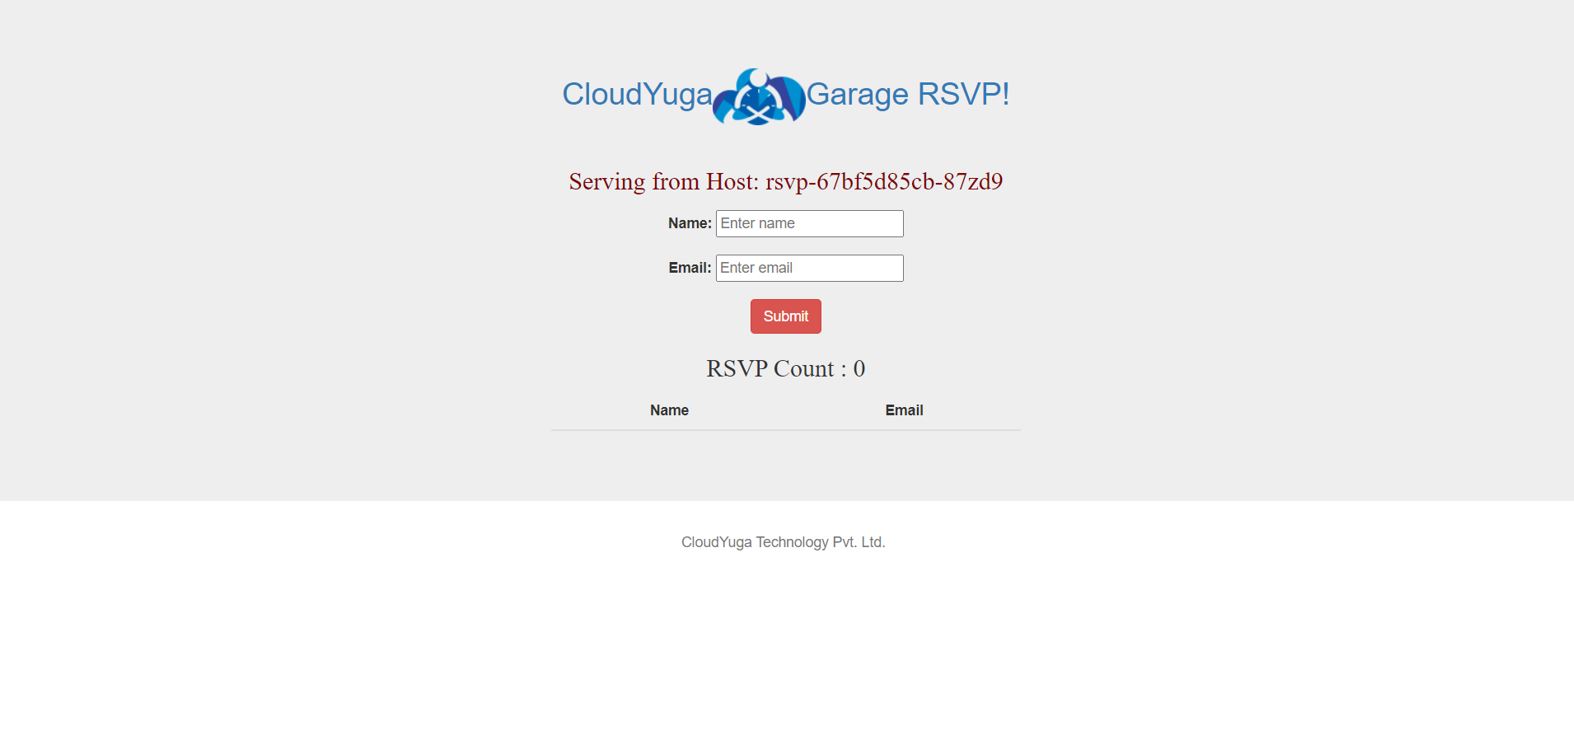
Now, access the app which will get an rsvp app like shown in the image below.
- To check the pod metrics, configure the metrics server. Keda already has a metrics adapter for this but as an end-user to see CPU utilization, this needs to be installed.
apiVersion: v1
kind: ServiceAccount
metadata:
  labels:
    k8s-app: metrics-server
  name: metrics-server
  namespace: kube-system
---
apiVersion: rbac.authorization.k8s.io/v1
kind: ClusterRole
metadata:
  labels:
    k8s-app: metrics-server
    rbac.authorization.k8s.io/aggregate-to-admin: "true"
    rbac.authorization.k8s.io/aggregate-to-edit: "true"
    rbac.authorization.k8s.io/aggregate-to-view: "true"
  name: system:aggregated-metrics-reader
rules:
- apiGroups:
  - metrics.k8s.io
  resources:
  - pods
  - nodes
  verbs:
  - get
  - list
  - watch
---
apiVersion: rbac.authorization.k8s.io/v1
kind: ClusterRole
metadata:
  labels:
    k8s-app: metrics-server
  name: system:metrics-server
rules:
- apiGroups:
  - ""
  resources:
  - nodes/metrics
  verbs:
  - get
- apiGroups:
  - ""
  resources:
  - pods
  - nodes
  verbs:
  - get
  - list
  - watch
---
apiVersion: rbac.authorization.k8s.io/v1
kind: RoleBinding
metadata:
  labels:
    k8s-app: metrics-server
  name: metrics-server-auth-reader
  namespace: kube-system
roleRef:
  apiGroup: rbac.authorization.k8s.io
  kind: Role
  name: extension-apiserver-authentication-reader
subjects:
- kind: ServiceAccount
  name: metrics-server
  namespace: kube-system
---
apiVersion: rbac.authorization.k8s.io/v1
kind: ClusterRoleBinding
metadata:
  labels:
    k8s-app: metrics-server
  name: metrics-server:system:auth-delegator
roleRef:
  apiGroup: rbac.authorization.k8s.io
  kind: ClusterRole
  name: system:auth-delegator
subjects:
- kind: ServiceAccount
  name: metrics-server
  namespace: kube-system
---
apiVersion: rbac.authorization.k8s.io/v1
kind: ClusterRoleBinding
metadata:
  labels:
    k8s-app: metrics-server
  name: system:metrics-server
roleRef:
  apiGroup: rbac.authorization.k8s.io
  kind: ClusterRole
  name: system:metrics-server
subjects:
- kind: ServiceAccount
  name: metrics-server
  namespace: kube-system
---
apiVersion: v1
kind: Service
metadata:
  labels:
    k8s-app: metrics-server
  name: metrics-server
  namespace: kube-system
spec:
  ports:
  - name: https
    port: 443
    protocol: TCP
    targetPort: https
  selector:
    k8s-app: metrics-server
---
apiVersion: apps/v1
kind: Deployment
metadata:
  labels:
    k8s-app: metrics-server
  name: metrics-server
  namespace: kube-system
spec:
  selector:
    matchLabels:
      k8s-app: metrics-server
  strategy:
    rollingUpdate:
      maxUnavailable: 0
  template:
    metadata:
      labels:
        k8s-app: metrics-server
    spec:
      containers:
      - args:
        - --cert-dir=/tmp
        - --kubelet-insecure-tls=true
        - --secure-port=4443
        - --kubelet-preferred-address-types=InternalIP,ExternalIP,Hostname
        - --kubelet-use-node-status-port
        - --metric-resolution=15s
        image: registry.k8s.io/metrics-server/metrics-server:v0.6.4
        imagePullPolicy: IfNotPresent
        livenessProbe:
          failureThreshold: 3
          httpGet:
            path: /livez
            port: https
            scheme: HTTPS
          periodSeconds: 10
        name: metrics-server
        ports:
        - containerPort: 4443
          name: https
          protocol: TCP
        readinessProbe:
          failureThreshold: 3
          httpGet:
            path: /readyz
            port: https
            scheme: HTTPS
          initialDelaySeconds: 20
          periodSeconds: 10
        resources:
          requests:
            cpu: 100m
            memory: 200Mi
        securityContext:
          allowPrivilegeEscalation: false
          readOnlyRootFilesystem: true
          runAsNonRoot: true
          runAsUser: 1000
        volumeMounts:
        - mountPath: /tmp
          name: tmp-dir
      nodeSelector:
        kubernetes.io/os: linux
      priorityClassName: system-cluster-critical
      serviceAccountName: metrics-server
      volumes:
      - emptyDir: {}
        name: tmp-dir
---
apiVersion: apiregistration.k8s.io/v1
kind: APIService
metadata:
  labels:
    k8s-app: metrics-server
  name: v1beta1.metrics.k8s.io
spec:
  group: metrics.k8s.io
  groupPriorityMinimum: 100
  insecureSkipTLSVerify: true
  service:
    name: metrics-server
    namespace: kube-system
  version: v1beta1
  versionPriority: 100
kubectl apply -f components.yaml
kubectl get pods -n kube-system
- Check the resource utilization of the pods by running the following command
kubectl top pods
- Now, to increase the load and usage on the app, install locust through pip, and install Flask as a prerequisite for locust.
apt update && apt install python3-pip -y
pip install flask
pip install locust
- Create a locustfile for load testing
# locust_file.py
import time
from locust import HttpUser, task, between

class WebsiteUser(HttpUser):
    wait_time = between(1, 5)

    @task
    def check_page(self):
        self.client.get(url="/")
locust -f locust_file.py --host <APP_URL> --users 500 --spawn-rate 200 --web-port=8089
Here, replace <APP_URL> with the rsvp app URL and access the locust UI from the port-8089 URL and will see a locust UI as shown in the image below.

Click the Start swarming button in the locust UI to enable the load on the rsvp app and will see an output like below.

- To enable scaling of pods with KEDA and Prometheus, create a
Prometheus ScaledObjectforrsvpdeployment (frontend.yaml)
apiVersion: keda.sh/v1alpha1
kind: ScaledObject
metadata:
  name: prometheus-scaledobject
  namespace: default
spec:
  minReplicaCount: 1
  maxReplicaCount: 4
  scaleTargetRef:
    name: rsvp
  triggers:
  - type: prometheus
    metadata:
      serverAddress: <PROMETHEUS-UI URL>
      metricName: container_cpu_usage_seconds_total
      threshold: '10'
      query: sum(container_cpu_usage_seconds_total{pod=~"rsvp-.*"})
Here, inside scaleTargetRef (line 9), the name of the resource and, by default, its kind is deployment is mentioned along with the type of triggers currently here, Prometheus. Prometheus trigger(line 11) has certain details such as:
- serverAddress – It will have a URL to the Prometheus server. Replace the
<PROMETHEUS-UI URL>with theprometheus-uiURL. - metricName: It will contain the name of the metric which will be used for scaling. Here we are using
container_cpu_usage_seconds_totalto find the CPU usage by thersvpdeployment. - threshold: This will have the value of CPU usage by deployment and as soon as it reaches this threshold, the deployment will be scaled up.
- query: It has the PromQL query to scrape the metrics from the application and start scaling according to the response. Currently, it has
sum(container_cpu_usage_seconds_total{pod=~"rsvp-.*"}), this query will give the sum of the CPU usage by all the pods ofrsvpdeployment.
kubectl apply -f prometheus-scaler.yaml
kubectl get scaledobjects
This ScaledObject will also create HPA, check that through the following command
kubectl get hpa
- As soon as the load starts getting increased on the application, KEDA starts working and will scale up the pods with HPA.
kubectl top pods
kubectl get hpa
kubectl get pods
Conclusion
In this hands-on lab, we saw how to scale the application by using KEDA and Prometheus.
