Efficient Strategies for Logging, Analysis, and Visualization
As we live in a digital world, people want applications to be operational 24X7. To achieve that, we need to solve the issues quickly or predict the issues in advance. Hundreds of microservices and thousands of servers are working behind the scenes. If something goes wrong, then how to debug it? To track the real-time issue, we rely on observability.
Observability is achieved by analyzing the following components,
- Logs: It provides information about the
eventsthat occurred at a specific time. - Metrics: These are the Key Performance Indicators (KPIs) which include requests served, response time, CPU load, memory usage, latency, etc., and help
monitorthe system based on them. - Traces: It shows the series of activities of a request as it goes through the application and helps
locatethe source of an alert.
Different agents collect, transform and send these data to a centralized location for analysis. This hands-on lab will focus on vector agents for log ingestion in the parseable log engine. Parseable is a newly created lightweight, cloud-native log observability engine written in Rust Language. Please refer our Introduction to Parseable hands-on lab for more detail.
What are Log Agents?
Aggregating and analyzing log data from different microservices in different formats is difficult. Log agents collect data from various sources of different forms, aggregate, process, and forward them to store in one place.
Examples of log agents
- Fluent Bit: Fluent Bit is an
open-source, fastlog processorandForwarder. - Vector: Vector is an
open-source,high-performance agentandaggregatorthat gives fullcontrolto the observability data. - Logstash: Logstash is a
freeandopen-sourceserver-side data processing pipeline thataggregates,transforms, andsendsit to the store.
What is Vector?
Vector is a lightweight and high-performance tool for building observability pipelines. It is a unified system that supports collecting logs and metrics data into a structured representation of an event at any point in time. Vector is written in Rust and is designed to be fast, reliable, and secure.
Vendor neutrality, rich data model, and highly configurable transforms with the Vector Remap Language are the core principles of Vector.
Components of vector
There are three major components serving specific purposes, as shown in the below figure:

- Sources: Vector supports several sources. Each source is literally a source of observability data. Source component allows users to collect observability data from different sources such as Kubernetes logs, NGINX metrics, OpenTelemetry etc.
- Transforms: Transforms allow operating on the data collected from the source (before it is sent over). In this step, you can filter, route, remap, throttle the data, before sending to a sink.
- Sinks: This is where Vector sends the data after the previous steps. Parseable for example, a sink for Vector. Vector supports several sinks.
Vector Deployment Roles
Vector can be deployed in two different roles: Agent and Aggregator. Agents are lightweight instances deployed on each host to collect and forward logs to either an Aggregator or a centralized log management system. Agents can run as sidecars or as daemon sets in Kubernetes clusters. Agents offer a simple and efficient way to collect logs from multiple sources and forward them to a centralized location.
Setup Logging Pipeline with Vector and Parseable
In this section, we will set up a logging pipeline with Vector and Parseable. We will use Vector as an agent to collect logs from a Kubernetes cluster and send them to Parseable for analysis. Finally, we’ll visualize this data with the help of the Parseable data source plugin in a Grafana dashboard.

In the above figure, Vector works as a log collector, agent, and forwarder.
- First, Vector’s kubernetes_logs
source will collect the logs from all Kubernetes pods. We’ll run Vector as a DaemonSet. - Then, we’ll decrease the number of HTTP requests and payload size using Vector’s feature batch and compression.
- Last, we will use the HTTP sink to deliver the logs to Parseable.
Pre-requisites
A Kubernetes cluster with your kubectl and helm configured to point to it.
kubectl get nodes
helm version
Install Parseable
- Create a secret file with configuration for Parseable. Make sure to change the username and password to your desired values.
cat << EOF > parseable-env-secret
addr=0.0.0.0:8000
staging.dir=./staging
fs.dir=./data
username=admin
password=admin
EOF
- Create a namespace for Parseable and create the secret.
kubectl create ns parseable
kubectl create secret generic parseable-env-secret --from-env-file=parseable-env-secret -n parseable
- Install Parseable using the Helm chart.
helm repo add parseable https://charts.parseable.io
helm install parseable parseable/parseable -n parseable --set "parseable.local=true"
- Expose the Parseable server UI by changing its service type.
kubectl patch -n parseable svc parseable -p '{"spec": {"ports": [{"port": 80,"targetPort": 8000,"protocol": "TCP","nodePort": 30000}],"type": "NodePort","selector": {"app.kubernetes.io/name": "parseable"}}}'Now, our application is ready and exposed on port-30000. Use admin as a username and password to log in. Please refer to our Introduction to Parseable lab to understand the installation in detail.
Let’s install Vector, which will have Kubernetes pod logs as its data source, and sink it to the Parseable server.
Install Vector
We’ll install Vector via Helm. We’ll use values.yaml file that has the configuration details for the vector source and sink.
wget https://www.parseable.io/vector/values.yaml
The values.yaml file has the following content.
  sources:
    kubernetes_logs:
      type: kubernetes_logs
  sinks:
    parseable:
      type: http
      method: post
      batch:
        max_bytes: 10485760
        max_events: 1000
        timeout_secs: 10
      compression: gzip
      inputs:
        - kubernetes_logs
      encoding:
        codec: json
      uri: 'http://parseable.parseable.svc.cluster.local/api/v1/ingest'
      auth:
        strategy: basic
        user: admin
        password: admin
      request:
        headers:
          X-P-Stream: vectordemo
      healthcheck:
        enabled: true
        path: 'http://parseable.parseable.svc.cluster.local/api/v1/liveness'
        port: 80
While most of the values.yaml file content is self-explanatory, we would like to highlight the batch section. Batch section allows configuring Vector to batch i.e. combine several log events in a single HTTP call. This allows sending much more data over a single HTTP call. Also, the compression section allows setting relevant compression algorithms for the HTTP payload.
These two combined, allow a much efficient way to push logs to Parseable over HTTP.
helm repo add vector https://helm.vector.dev
helm install vector vector/vector --namespace vector --create-namespace --values values.yaml
You should see an output like below.
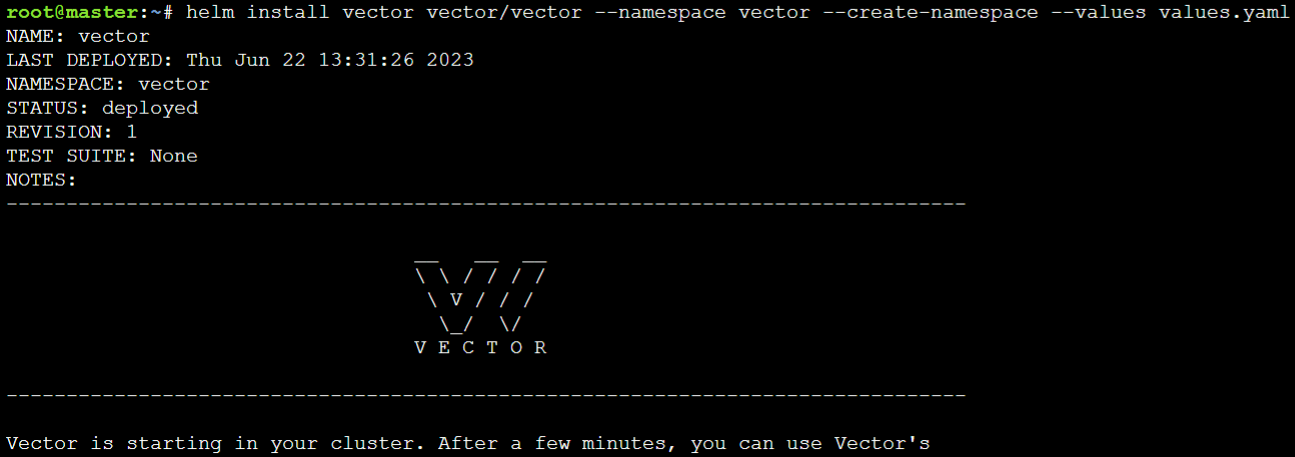
Vector should now start to collect logs from the pods in the vectordemo log stream. The vector log stream is created through request headers.
- This Kubernetes log source accesses the /var/log/pods directory to access the pod’s logs from the Kubernetes nodes.
ls -l /var/log/pods
- To view the logs in Parseable UI, Refresh
port-30000URL, which we accessed in the previous sub-section.

Now, we can view the log stream vectordemo data in Parseable. Next, we will integrate the parseable server with Grafana to observe the data more clearly.
Install Grafana and Parseable Data Source Plugin
Grafana is designed to store and query logs from all our applications and infrastructure.
- Install Grafana using
Helmto configure the Parseable datasource plugin to bettervisualizeParseable server data.
helm repo add grafana https://grafana.github.io/helm-charts
helm install grafana grafana/grafana \
--namespace grafana \
--create-namespace \
- Expose the
Grafana UIby changing its service type.
kubectl patch -n grafana svc grafana -p '{"spec": {"ports": [{"port": 80,"targetPort": 3000,"protocol": "TCP","nodePort": 30001}],"type": "NodePort","selector": {"app.kubernetes.io/name": "grafana"}}}'Now, we can access the Grafana UI from the port-30001.
- Use the below command to get the password for the
adminGrafana user.
kubectl get secret --namespace grafana grafana -o jsonpath="{.data.admin-password}" | base64 --decode ; echoAs we have a logstream in Parseable, we will add the Parseable Plugin in Grafana.
- Click on Add your first data source on the home page of
Grafanaand search for parseable Plugin under the Plugins section. Click on it and Install it.

- After installation, Click on Create a Parseable data source button and add Parseable server details.
- Now, Provide the Parseable server URL, which we will get from the
port-30000url. - Enable Basic Auth and give
Parseable server credentials. Click on the save & test button.

- Select logstream, which is added with parseable to view the details like column names, event count, etc. In this case, we’ll use the stream
vectordemo.
Execute the below SQL query by clicking on the Run Query button.
select * from vectordemo

We can now create a dashboard with the data from Parseable.

Conclusion
This hands-on lab demonstrates how to set up a logging pipeline with Vector and Parseable. We used Vector as an agent to collect logs from a Kubernetes cluster and send them to Parseable for analysis. Finally, we visualized this data with the help of the Parseable data source plugin in a Grafana dashboard.
We hope this hands-on lab helped in understanding the integration of Vector with Parseable and Grafana.
What’s next?
To understand how analyzing logs can help detect security threats in a Kubernetes cluster with Kubernetes auditing and Parseable. Explore our hands-on lab on this.
References
https://vector.dev/docs/about/concepts/
