Discover and learn about Parseable , a new cloud-native log observability stack
Log data has become one of the most important parts of the business, which plays an important role in its reliability and security. Previously, logs from applications and servers were saved to files on local disks. But to save space on disks from getting filled up, log files have been rotated by logrotate tools.
But with the rise in internet usage in the early 2000s, people soon realized that log data from different user applications could help understand user behavior and scale out businesses quickly. The studying of huge log data of different structures and from different sources becomes difficult.
Every type of log data has its characteristics and use cases. It gives rise to logging challenges such as storage, correlation, ingestion, etc. Then observability becomes a new trend in the market for businesses to rely on and manage all log types at scale.
The software industry develops SaaS products to abstract all complexities of running and managing large and different log data at scale by building a unified platform. One has to ingest data, and you will get beautiful dashboards and alerts to run the business efficiently.
But these SaaS products have high costs with less flexibility in integrating with other systems. These also hide how they store and process your data. In the open-source world, no great alternatives exist, providing complete data ownership, avoiding vendor lock-in, and giving interoperability freedom.
Recently, Parseable has been introduced to the world, which helps solve the logging challenges and is an alternative to various SaaS offerings.
This hands-on lab will discuss Parseable’s features, various concepts, how it fits in the logging ecosystem, and a lab demo of how it works inside a Kubernetes cluster with its Grafana data source plugin.
What is Parseable?
Parseable is a free, open-source, lightweight, purpose-built cloud-native log observability engine. It is being developed in Rust (Actix Web framework), which uses Apache Arrow and Parquet as data structures. Apache Arrow provides columnar storage formats in memory and Parquet on disk, making it a high-performance system to ingest, store, and query data at a large scale with low latency.
Benefits of Parseable
- As it is being developed in Rust, the Parseable server guarantees to take 50% less CPU and 80% less memory consumption than Elasticsearch (JVM-based solutions) for a similar ingestion workload. Read more about it here.
- It uses an index-free approach to allow high throughput ingestion with low latency in queries and comes with a single binary with built-in UI.
- Apache Arrow and Parquet-like open data formats give full physical access to your data and tools in the Parquet ecosystem, opening doors for advanced analytics.
- Specially made for a cloud-native system with a stateless design with the help of an object store.
- Enable logging and observability, a first-class citizen of the software development cycle as it can be deployed anywhere within minutes, whether it’s a public/private cloud, containers or VMs, or bare metal environments.
Parseable Features
- Easy to deploy within a few minutes and easily ingest data from different sources to gain valuable insights.
- Gives the flexibility to use its storage backend: local volumes or S3-compatible object store.
- Schema-free design, which allows easy ingestion of any type of log data.
- Ingestion API with compatible HTTP output of log agents
- PostgreSQL-based queries for log search and analysis with Parseable UI or Grafana data source plugin for visualization.
- Parseable has other integrations, such as Kafka, Redpanda, AWS Lambda, etc.
- Send alerts to webhook targets such as Slack.
- Provides Stats API to track ingestion and compressed data.
Parseable in Logging Ecosystem
The logging ecosystem comprises several components, such:
- Logging Libraries
- Logging Agents/Forwarders
- Logging Platforms
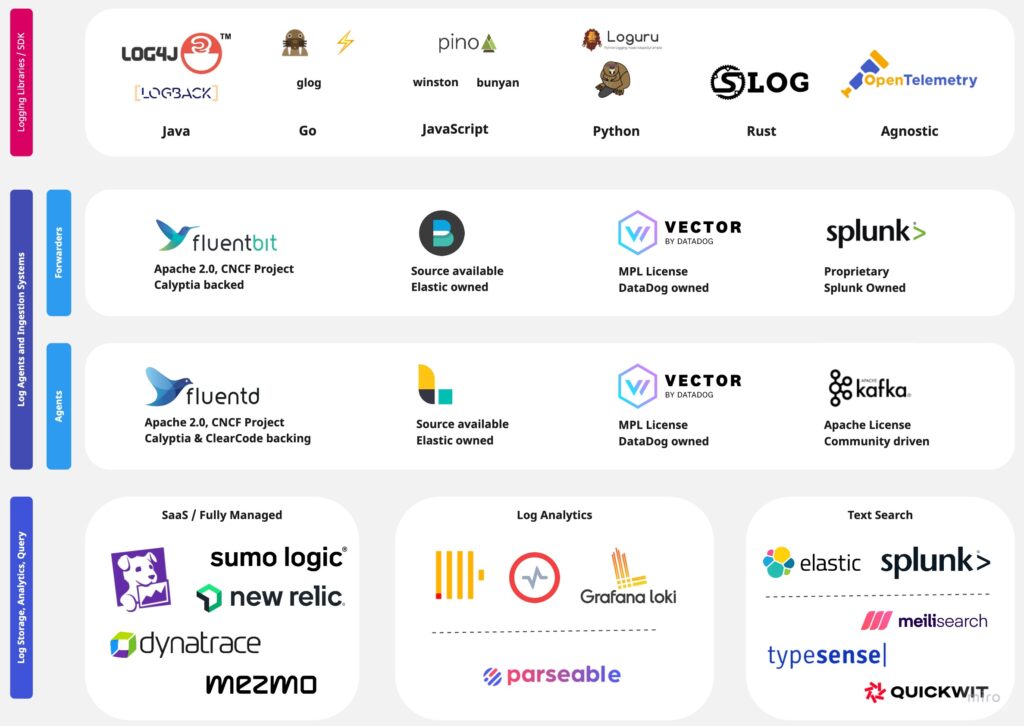
Logging Libraries
This is the first step in a logging setup. The logging libraries help emit logs in a predefined format (text, JSON, etc.) on a standard console or to a file. This decision is made by the development team based on the programming language, resource consumption, and log data format.
Some of the common logging libraries in different programming languages are:
- Javascript: Winston, Pino, etc
- Python: Log, Loguru, etc
- Go : glog, Logrus etc
- Java : Std log ,Log4j etc
- Rust: Log etc
Logging Agents and Forwarders
After deciding logging libraries and to have data in a particular format, the next step is to use logging agents and forwarders. They collect logs from the application output (console or file) and store them in a centralized location. But both stand apart due to a small difference between them.
Forwarders are lightweight, run on each host, and forward logs to a centralized location without additional data processing. Examples are FluentBit, FileBeat, Vector, etc.
Agents run on a dedicated host only and can perform additional processing on logs, such as parsing, filtering, sampling, etc., before sending them to a centralized location. Examples are FluentD, Logstash, Vector Aggregator, etc.
Logging Platforms
This is the final step in the logging pipeline, where logs are stored from forwarders/agents in a scalable and reliable manner. It also provides an interface for text search and analysis.
Earlier log data was text-oriented, and text search engines with indexed log entries were used to look for specific patterns. Examples of such logging platforms are Elastic, Splunk, etc. But now, with different types of log data in structured and unstructured formats, different log analytics platform has become a good choice.
They can ingest logs, parse them, and store them in an optimized format for analysis, such as Parseable. Some fully managed platforms, such as DataDog, NewRelic, etc., are also built for the log analytics paradigm.
Depending on the use case, one can decide whether to use search engines or analytics databases as their logging platform.
Key Terminologies
Parseable uses certain terminologies as part of its concepts.
Authentication
The Parseable server requires Basic Authentication. The username and password for the Parseable server are set as P_USERNAME and P_PASSWORD environment variables. The default username and password is admin for both.
Ingestion
Log data is ingested to the Parseable server via HTTP POST requests with data as JSON payload. One can integrate Parseable with applications with REST API calls or can use logging agents.
Log Streams
The log streams are an important part of Parseable, which has a unique name. The log data are ingested into a Parseable log stream. It uses a dynamic schema, and the user doesn’t have to define/modify the schema for the log stream.
Storage
Once the data payload reaches, it is validated with Apache Arrow format in memory. On further processing, it is converted into Parquet and then pushed to S3 or local storage backend.
Lab with Parseable
Let’s look more closely at Parseable with a hands-on lab, where we will install it by setting it up completely with different environment variables. Then we will create a Python application for sending logs to the Parseable server. Along with this, we will also configure the Parseable data source plugin in Grafana.
Parseable Installation
There are several ways to install Parseable, but we will use Helm to install it on the Kubernetes cluster.
- Install Helm if it is not already installed.
curl -fsSL -o get_helm.sh https://raw.githubusercontent.com/helm/helm/main/scripts/get-helm-3
chmod 700 get_helm.sh
./get_helm.sh
helm version
NOTE: We will now be setting up Parseable with local storage. One can use minio as a backend or other object stores like AWS S3.
- Prepare a secret file with Parseable configuration details and create a secret in the Kubernetes cluster.
cat << EOF > parseable-env-secret
addr=0.0.0.0:8000
staging.dir=./staging
fs.dir=./data
username=admin
password=admin
EOF
kubectl create ns parseable
kubectl create secret generic parseable-env-secret --from-env-file=parseable-env-secret -n parseable
Visit here to check different environment variables supported by the Parseable server.
- Install Parseable via helm and configure local storage
helm repo add parseable https://charts.parseable.io
helm install parseable parseable/parseable -n parseable --set "parseable.local=true"
- Wait for some time to get the parseable pods in the running state
kubectl get all -n parseable
- Change the parseable service to
NodePorttype
kubectl patch -n parseable svc parseable -p '{"spec": {"ports": [{"port": 80,"targetPort": 8000,"protocol": "TCP","nodePort": 30000}],"type": "NodePort","selector": {"app.kubernetes.io/name": "parseable"}}}'Access the Parseable UI from app-port-30000 url under the Lab Urls section. Login in as admin user and password.
Grafana Installation and Add Parseable Plugin
- Install Grafana to configure the Parseable plugin to better visualize Parseable server data.
helm repo add grafana https://grafana.github.io/helm-charts
helm install grafana grafana/grafana \
--namespace grafana \
--create-namespace
- Wait for some time to get the Grafana pods in the running state
kubectl get all -n grafana
- Change the Grafana service to
NodePorttype
kubectl patch -n grafana svc grafana -p '{"spec": {"ports": [{"port": 80,"targetPort": 3000,"protocol": "TCP","nodePort": 30001}],"type": "NodePort","selector": {"app.kubernetes.io/name": "grafana"}}}'Access the Grafana UI from the app-port-30001 url under the Lab Urls section.
- Retrieve the password to login into Grafana as an admin user.
kubectl get secret --namespace grafana grafana -o jsonpath="{.data.admin-password}" | base64 --decode ; echo- Click on Add Data Sources on the home page and search for Parseable Plugin under the
Pluginssection. Click on it and Install it.
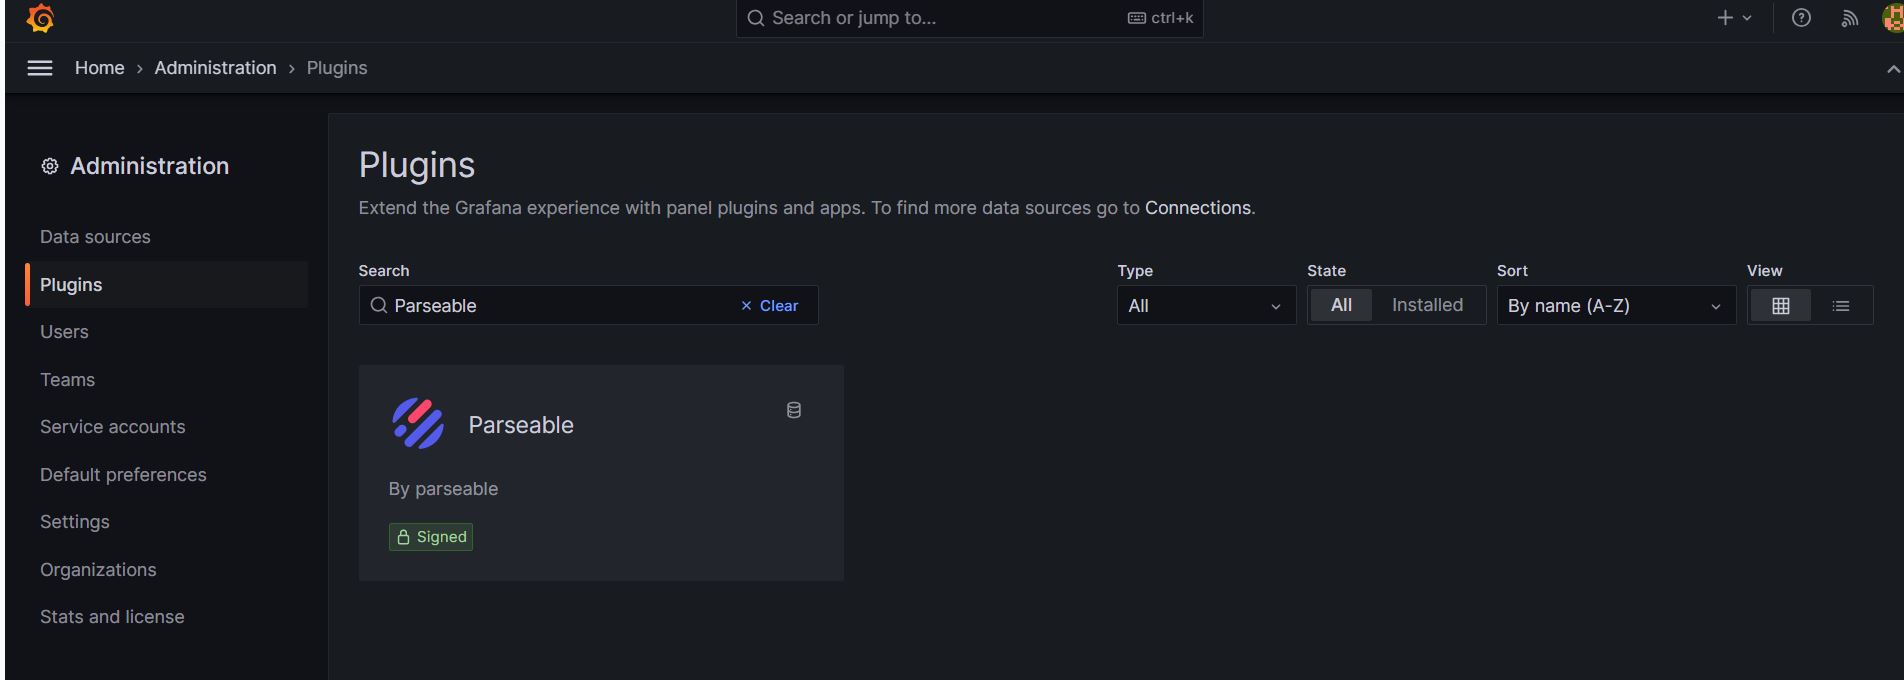
- Click on Create a Parseable data source button and add Parseable server details.

- Provide the Parseable server URL, which you will get from the
app-port-30000url. Enable Basic Auth and give Parseable server credentials.


Click on Save & test button.
Now create a Python application to send logs to the Parseable server, and we will query it with Python code and through the Parseable data source Grafana Plugin in the Grafana dashboard.
Logs from Python Application
- Create a log stream for the Python application. One can use one log stream per application, assuming all have the same schema.
# logstream.py

import requests

# TODO: Replace the url with your Parseable URL and stream name
url = "https://<parseable-url>/api/v1/logstream/<stream-name>"
payload = {}

headers = {
    # TODO: Replace the basic auth credentials with your Parseable credentials
    "Authorization": "Basic YWRtaW46YWRtaW4="
}

response = requests.request("PUT", url, headers=headers, data=payload)

print(response.text)
Example for url: “https://c-287789b6-39cd-427c-933a-a6b3a7ee1049-cloudyuga-28466807-u42ft.cloudyuga.guru/api/v1/logstream/demopython“.
Here demopython is the stream name, which can be changed according to the user. You will get your Parseable server url from the app-port-30000 url.
python3 logstream.py
- Start sending logs to the log stream created above with HTTP POST requests.
# payload.py

import requests
import json

# TODO: Replace the url with your Parseable URL and stream name
url = "https://<parseable-url>/api/v1/logstream/<stream-name>"


payload = json.dumps(
    [
        {
            "id": "434a5f5e-2f5f-11ed-a261-asdasdafgdfd",
            "datetime": "24/Jun/2022:14:12:15  0000",
            "host": "153.10.110.81",
            "user-identifier": "Mozilla/5.0 (Windows NT 6.1; Win64; x64; rv:64.0) Gecko/20100101 Firefox/64.0",
            "method": "PUT",
            "status": 500,
            "referrer": "http://www.google.com/",
        }
    ]
)

headers = {
    # INFO: Use X-P-META-<key>:<value> to add custom metadata to the log event
    "X-P-META-Host": "192.168.1.3",
    # INFO: Use X-P-TAG-<key>:<value> to add tags to the log event
    "X-P-TAGS-Language": "python",
    # TODO: Replace the basic auth credentials with your Parseable credentials
    "Authorization": "Basic YWRtaW46YWRtaW4=",
    "Content-Type": "application/json",
}

response = requests.request("POST", url, headers=headers, data=payload)
print(response.text)
- Prepare a bash script to help us create bulk data from the above payload data.
#!/bin/bash
for i in $(seq 1 200)
do
  python3 payload.py
  echo "$i times loop run"
done
bash load.sh
- Query the log stream data with standard SQL. Also, Parseable supports SQL-based queries for log search and analysis.
# query.py

import requests
import json

# TODO: Replace the url with your Parseable URL
url = "https://<parseable-url>/api/v1/query"

payload = json.dumps(
    {
        # TODO: Replace the stream name with your log stream name
        "query": "select * from <stream-name>",
        # TODO: Replace the time range with your desired time range
       "startTime":"<current-date>T00:00:00+00:00",
       "endTime":"<current-date>T23:59:00+00:00"
    }
)
headers = {
    # TODO: Replace the basic auth credentials with your Parseable credentials
    "Authorization": "Basic YWRtaW46YWRtaW4=",
    "Content-Type": "application/json",
}

response = requests.request("POST", url, headers=headers, data=payload)

print(response.text)
python3 query.py
Now, let’s query the same data with the help of the Parseable Plugin in Grafana.
Query Logs from Parseable server and Data source Plugin in Grafana
- Verify the data inside the Parseable server

- Now, inside Grafana, select the logstream and execute the same SQL query mentioned in
query.py.Then click on the Run query button.

The same data will be retrieved in the Grafana and in a better format to analyze it.
Conclusion
In this blog, we learned in detail about Parseable and where it fits in the logging ecosystem. We also sent logs via Python application through REST API calls and analyzed data with the Grafana data source plugin.
What’s next?
To learn more about Parseable and how it works with logging agents. Try our other blog in which we integrated a Vector logging agent with Parseable.
